
By BERLINDA LIU
The author is Director of Global Research & Design at S&P Dow Jones Indices
Many market participants attempt to identify future top-performing funds using managers’ track records. This practice implicitly assumes that managers’ successful track records reflect skill and that their superior performance will be repeated in the future. Since genuine skill is likely to persist, one key measure of active management skill is the consistency of a fund’s outperformance against its peers.
The U.S. Persistence Year-End 2019 Scorecard shows that few fund managers have consistently outperformed their peers.
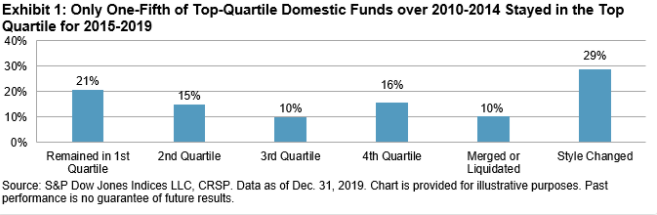
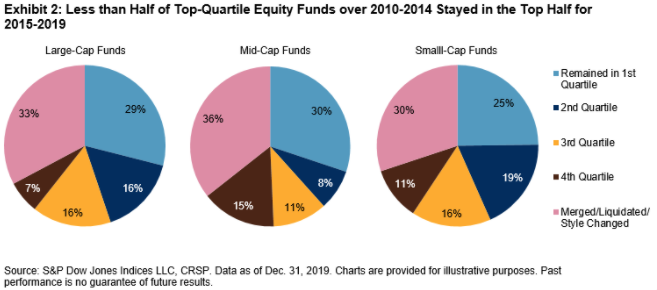
The report tracks the top-quartile domestic equity funds of 2010-2014 and evaluates their relative performance for the 2015-2019 period. Contrary to the intuition that a top-quartile fund is more likely to stay in the leading pack, the report shows that their most likely outcome was liquidation or style change (39% together). Only 36% were able to beat the median performer of the peer group (see Exhibit 1). The same story occurred across all major domestic equity categories (see Exhibit 2); less than half of the 2010-2014 top-quartile funds stayed in the top half of the peer group for 2015-2019, and about one-third of them were merged, liquidated, or had a style change.
The most recent performance also cannot predict the future. For example, only 3.84% of domestic equity funds in the top half of the distribution in 2015 maintained that status annually through 2019, significantly below what random chance would predict.[1] Similarly, just 0.18% of 2015’s top-quartile domestic equity funds maintained that performance over the next four years, again below random chance.[2]
Nevertheless, the report confirms that the worst-performing funds tend to end up in the merge or liquidation category. Fourth-quartile funds were generally the most likely to merge or liquidate over the subsequent three- and five-year windows, with nearly 38% of the bottom-quartile multi-cap funds of 2010-2014 disappearing by 2019.
Perhaps more surprisingly, style changes did not appear to be correlated with fund performance. Top, middle, and bottom performers within a category all generally had similar chances of style drift over the three- and five-year periods. Multi-cap funds had the highest percentage of style change, with 31% making a change over three years and 40% over five years.
The latest U.S. Persistence Scorecard underscores the general warning that past performance is no guarantee of future results. Like our previous reports, the study did not find evidence supporting performance persistence among active managers. Distilling active management skill from random success requires more complicated methodology beyond a mere peek at track records.
[1] The odds of a top-half fund in one year randomly staying in the top half over the next four years are 50% * 50% * 50% * 50% = 6.25%, or 1/16.
[2] 25% * 25% * 25% * 25% = 0.39%, or 1/256.
This article was first published on the Indexology blog.
Here are some other recent articles from S&P Dow Jones Indices that we’ve featured on TEBI:
Three hundred and twenty billion dollars
US fund managers flopped in the crisis
92% of Canadian fund managers underperformed in 2019
Does adjusting for risk make active performance any better?
How did Australian active managers handle Q1 volatility?
European active funds lagging the index in the crisis
Picture: RUN 4 FFWPU via Pexels


