
It’s well documented that the premium associated with value stocks is long overdue. So now is not a good time to lose patience with it. Something that value investors might want to take a look at, however, is how heavily exposed they are to companies with high greenhouse gas (GHG) emissions. As BERND HANKE from Global Systematic Investors explains, many value funds are heavily weighted towards stocks that are contributing to global warming. So, how big a problem is it? And what can you do about it?
Greenhouse gas (GHG) emissions are at the forefront of climate change discussions. Behind the struggle to address global warming and climate change lies the increase in greenhouse gases in our atmosphere. A greenhouse gas is any gas compound in the atmosphere that is capable of absorbing infrared radiation, thereby trapping and holding heat in the atmosphere. By increasing the heat in the atmosphere, greenhouse gases are responsible for the greenhouse effect, which ultimately leads to global warming.
Because of this key role that GHG emissions play in the process of global warming, many environmentally conscious investors have been exploring investment strategies that seek to limit exposure to companies with high GHG emissions.
In this newsletter we explore GHG emissions in the context of value investment strategies. To do this, we use a metric which we label “GHG Intensity” and which is computed as a company’s GHG emissions divided by its enterprise value (EV). We measure total GHG emissions as the sum of GHG scope 1 emissions (GHG1) and GHG scope 2 emissions (GHG2). Scope 1 emissions are greenhouse gases produced directly from sources that are owned or controlled by a company. Scope 2 emissions are the indirect greenhouse gases resulting from the generation of electricity, heating and cooling and steam off site but purchased by a company.[1]
We therefore compute GHG Intensity as follows:
GHG Intensity = (GHG1 + GHG2) / EV
The enterprise value (EV) of a company is computed as follows:
EV = total market value of traded and non-traded equity (summed across share classes) + book value of total debt + minority interest
So, the enterprise value of a company is roughly the sum of its value of equity and its value of debt.
GHG emissions for value strategies
In order to compare the GHG Intensity of value investment strategies to that of market weighted (purely passive) portfolios, we examine two widely used global value funds that are based on well-known indices. The value funds that we compare and contrast are the following:
— iShares Core MSCI World UCITS ETF (benchmark: MSCI World)
— iShares Edge MSCI World Value Factor UCITS ETF (benchmark: MSCI World Enhanced Value Index)[2]
Both ETFs are widely used by investors. The iShares Core MSCI World ETF (which we label “MSCI” in the following paragraphs) had about $22.9 billion assets under management as of the end of June 2020 and the iShares Edge MSCI World Value Factor ETF (which we call “MSCI Value” in the following) had about $13 billion assets under management. Both ETFs almost fully replicate their benchmark indices, so their holdings are almost identical to the corresponding index constituents at any given point in time.
The MSCI World Index captures large and mid-cap companies across 23 Developed Markets (DM) countries. It has roughly 1600 index constituents as of 30 June 2020. The MSCI World Enhanced Value Index captures companies from that same universe but exhibiting higher value style characteristics relative to their peers within the same Global Industry Classification sector (GICS). The value investment style characteristics for index construction are defined using three variables: Price-to-Book Value, Price-to-Forward Earnings and Enterprise Value-to-Cash flow from Operations. The MSCI World Enhanced Value Index is a good representation of commonly used value strategy portfolios and has roughly 400 index constituents as of 30 June 2020.
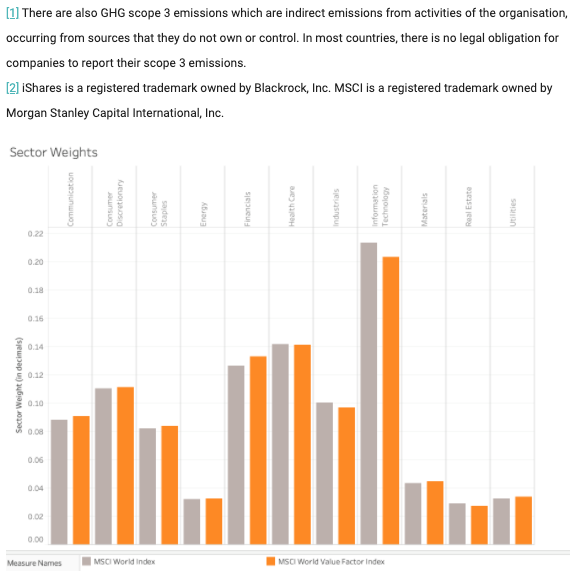
In order to compare the GHG Intensity of both types of portfolios, let’s examine some general portfolio characteristics first. As the graph below shows, global sector weights of both portfolios are almost exactly the same as of 30 June 2020.
[1] There are also GHG scope 3 emissions which are indirect emissions from activities of the organisation, occurring from sources that they do not own or control. In most countries, there is no legal obligation for companies to report their scope 3 emissions.
[2] iShares is a registered trademark owned by BlackRock, Inc. MSCI is a registered trademark owned by Morgan Stanley Capital International, Inc.
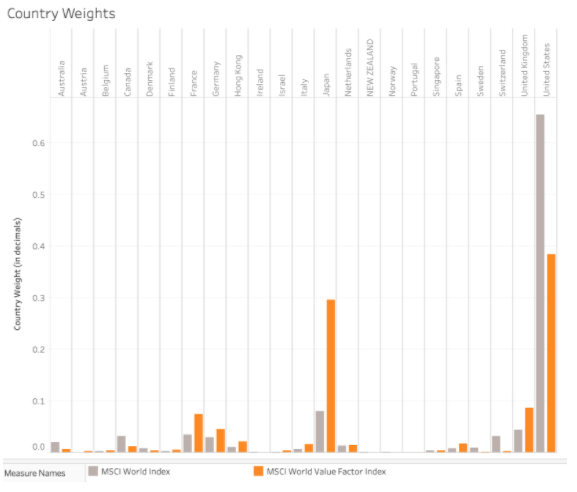
Country weights of developed markets differ much more markedly. In particular, MSCI Value allocates a much higher weight to Japan than MSCI which is due to the fact that Japan (in aggregate) exhibits attractive value characteristics. Most of the overweight in Japan of MSCI Value vs. MSCI comes from a corresponding underweight in the United States, a country with much less attractive value characteristics but which has a large global market weight.
If we divide up companies within the MSCI World universe into GHG Intensity deciles and then compute portfolio weights in each of these deciles, here’s what we get:
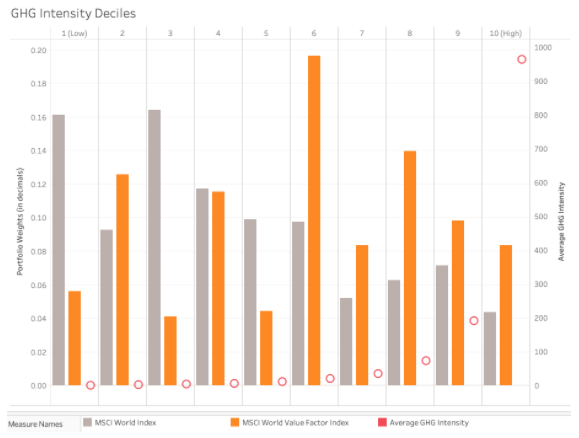
The chart above shows portfolio weights in each of the ten deciles for the MSCI and MSCI Value. In addition, it shows the average GHG Intensity of companies in each decile on the right-hand side vertical axis. Average GHG Intensities increase exponentially across deciles 7-10.
On the portfolio side, we can observe that for GHG Intensity deciles 1-5 (the low GHG Intensity deciles), a market weighted portfolio generally has a higher weight in these deciles than a value portfolio. However, for GHG Intensity deciles 6-10, a value portfolio exhibits much higher weights in these deciles than a market weighted portfolio. Therefore, on an overall portfolio level, a value portfolio has a considerably higher GHG Intensity than a market weighted (passive) portfolio. This puts a value strategy at a disadvantage for an environmentally conscious investor compared to a purely passive market weighted strategy. We need to stress that this is the case even though the value strategy we examine here does not tilt portfolio weights to sectors that have especially high GHG Intensity in any meaningful way. In fact, sector weights of the two portfolios are very similar.
As a result, the higher GHG Intensity of the value portfolio originates from stock selection within sectors rather than sector tilts away from a market weighted portfolio.
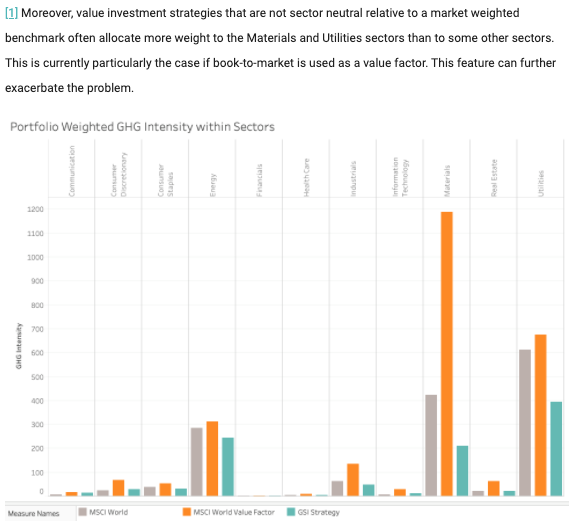
To shed some light on these within-sector tilts, we show portfolio weighted sector GHG Intensity tilts within sectors for both portfolios.
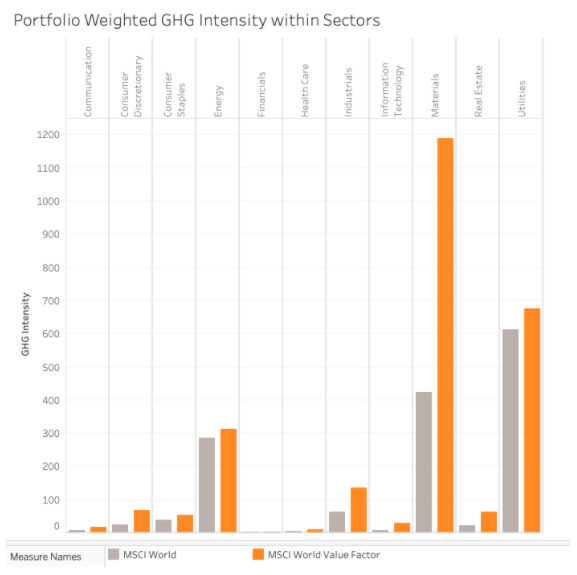
As we can see here, the value portfolio assigns higher weights to higher GHG Intensity companies within most sectors and in particular in sectors with very high average GHG Intensities such as Materials or Utilities. Especially, within the Materials sector the GHG Intensity of MSCI Value is substantially higher than for MSCI.[1]
Therefore, as a value investor running a sustainable portfolio, we need to be acutely aware of this pattern and we need to manage the GHG Intensity resulting from a standard value tilt. This can be done in various ways, either by completely excluding companies with high GHG Intensities from the portfolio or by underweighting them relative to a market weighted portfolio. It is relatively straightforward to do so as long as an investment manager is aware of this issue (and many are not!).
In our process, we tilt towards value but we avoid overweighting companies with high or extreme GHG Intensities. The graph below shows that the GSI portfolio almost always has a lower GHG Intensity than both MSCI and MSCI Value in each sector, particularly in the high GHG Intensity sectors. As a result, its overall portfolio GHG Intensity is substantially lower than that of a market weighted portfolio and a standard value portfolio. We achieve this lower portfolio-level GHG Intensity without sacrificing the payoff resulting from value factors.
[1] Moreover, value investment strategies that are not sector neutral relative to a market weighted benchmark often allocate more weight to the Materials and Utilities sectors than to some other sectors. This is currently particularly the case if book-to-market is used as a value factor. This feature can further exacerbate the problem.
Conclusion
Investors need to be aware of the fact that their value funds are likely to be highly exposed to companies with high GHG emissions, one of the main factors contributing to global warming. In order to mitigate this unwanted by-product of a value strategy, investment managers following a value strategy need to actively limit exposure to those companies in their investment process.
At GSI, GHG Intensity is one of the inputs into our portfolio construction process which is constantly monitored and mitigated. We are therefore able to capture the payoff associated with a value strategy in a sustainable and environmentally friendly manner.
BERND HANKE is Managing Partner, Co-Chief Investment Officer at Global Systematic Investors, a fund management company specialising in systematic factor investing, but with an emphasis on sustainability. This article was first published on the GSI blog and is republished here with permission.
Here are some recent TEBI posts you may have missed which we think you’ll find interesting:
Markets are more efficient than you think
Should you invest in one go or in instalments?
The one asset you need to protect
12 reasons why high-flying professionals fail at investing
Investing is not a competition
No more room at the factor zoo
Wealthy investors matching words with action on ESG
More proof that consultants can’t pick winning funds
The opportunity cost of choosing a “best-buy” fund
Did you know, TEBI can now put readers in touch with financial advisers in their area who share our evidence-based investment philosophy and our mission to improve investor outcomes?
In our view, investors’ interests are best served by working with a good financial adviser.
If you’d like to find an adviser who is suitable, simply complete our short questionnaire and we’ll get back in touch with you.
Picture: Annie Spratt via Unsplash


