
An argument we frequently hear in support of active investing is that stock market indexes are dominated by a small number of very large companies. If you index, the argument goes, you’re heavily exposed to a few major players.
Currently it’s the so-called FAANG stocks — Facebook, Amazon, Apple, Netflix, and Google — that dominate the US stock market, for example.
But how unusual is it for a stock market to be this top-heavy? And should investors be worried? This article from DIMENSIONAL FUND ADVISORS puts the FAANG phenomenon in perspective.
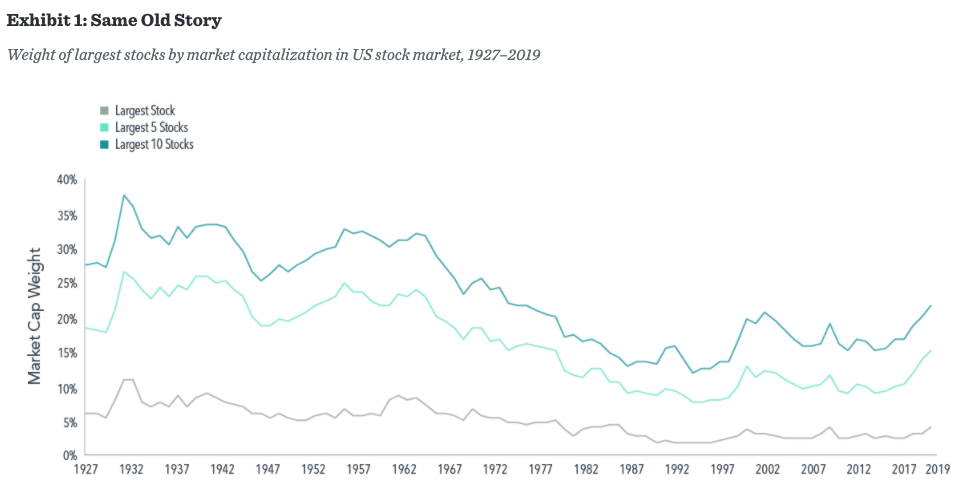
A top-heavy stock market with the largest ten stocks accounting for over 20% of market capitalisation and a marquee technology firm perched at No. 1? This sounds like a description of the current US stock market, dominated by Apple and the other FAANG stocks1. But it is actually a reference to 1967, when IBM represented a larger portion of the market than Apple at the end of 2019 (5.8% vs. 4.1%).
As we see in Exhibit 1, it is not particularly unusual for the market to be concentrated in a handful of stocks. The combined market capitalisation weight of the ten largest stocks, just over 20% at the end of last year, has been higher in the past.
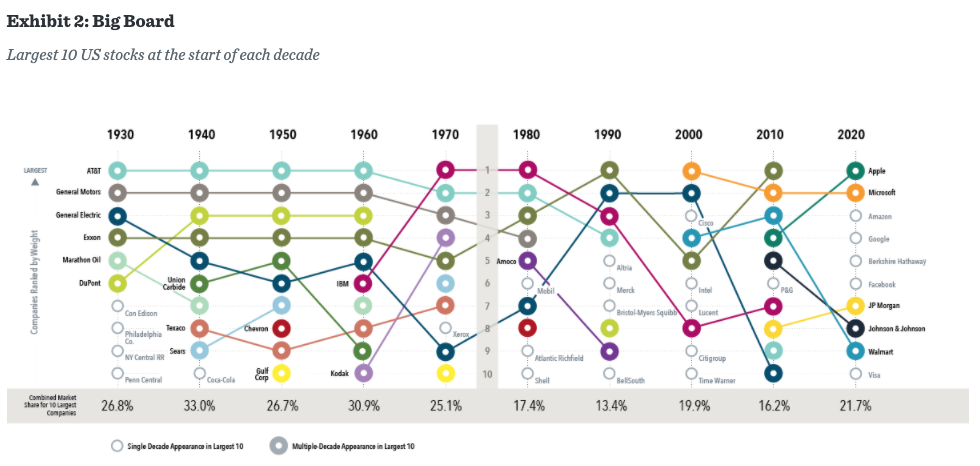
Some companies stay on top for a long time
A breakdown of the largest US stocks by decade in Exhibit 2 shows some companies have stayed on top for a long time. AT&T was among the largest two for six straight decades beginning in 1930. General Motors and General Electric ranked in the top ten at the start of multiple decades. IBM and Exxon were also mainstays in the second half of the 20th century.
Hence, concentration of the stock market in a few large companies such as the FAANG stocks in recent years is not a new normal; it is old normal.
Dominant firms have often been “high-tech”
Moreover, while the definition of “high-tech” is constantly evolving, firms dominating the market have often been on the cutting edge of technology. AT&T offered the first mobile telephone service in 1946. General Motors pioneered such innovations as the electric car starter, airbags, and the automatic transmission. General Electric built upon the original Edison light bulb invention, contributing to further breakthroughs in lighting technology, such as the fluorescent bulb, halogen bulb, and the LED. So technological innovation dominating the stock market is not a new normal; it is an old normal too.
Another trend attributed to a new normal is the extraordinary performance of FAANG stocks over the past decade, leading some to wonder if we should expect these stocks to continue such strong performance going forward.
Future expectations are already in the price
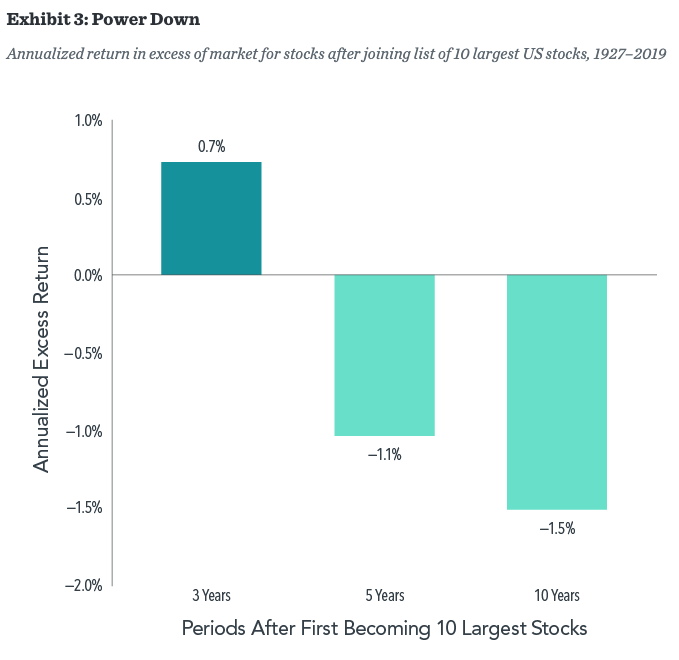
Investors should remember that any expectations about the future operational performance of a firm are already reflected in its current price. While positive developments for the company that exceed current expectations may lead to further appreciation of its stock price, those unexpected changes are not predictable.
To this point, charting the performance of stocks following the year they joined the list of the ten largest firms shows decidedly less stratospheric results. On average, these stocks outperformed the market by an annualised 0.7% in the subsequent three-year period. Over five- and ten-year periods, these stocks underperformed the market on average.
The only constant is change, and the more things change the more they stay the same. This seems an apt description of the dominant stocks atop the market.
While the types of businesses most prominent in the market vary through time, the fact that a small subset of companies’ stocks account for an outsized portion of the stock market is not new. And it remains impossible to systematically predict which large companies will outperform the stock market and which will underperform it. This underscores the importance of having a broadly diversified equity portfolio that provides exposure to a vast array of companies and sectors.
GLOSSARY
Fama/French Total US Market Research Index: The value-weighed US market index is constructed every month, using all issues listed on the NYSE, AMEX, or Nasdaq with available outstanding shares and valid prices for that month and the month before. Exclusions: American depositary receipts. Sources: CRSP for value-weighted US market return. Rebalancing: Monthly. Dividends: Reinvested in the paying company until the portfolio is rebalanced.
1Facebook, Amazon, Apple, Netflix, and Google (a subsidiary of Alphabet) are often referred to as the FAANG stocks.
Source for exhibits: Dimensional, using data from CRSP and Compustat. Includes all US common stocks. Largest stocks identified at the end of the calendar year preceding the respective decade by sorting eligible US stocks on market capitalisation using data provided by the Center for Research in Security Prices.
This article first appeared on the Dimensional Fund Advisors blog, Dimensional Perspectives.
Interested in more insights from Dimensional? Here are some other recent articles from this series:
Why the disconnect between the economy and markets?
The widening valuation spread between growth and value
What will the recession mean for small-cap stocks?
How worried should investors be about the recession?
Remember, you’ve trained for this
Study provides fresh insight on bond returns


