
Valuation spreads between growth and value stocks are the widest they have been since the turn of the Millennium. So what does this mean for investors? As this article from DIMENSIONAL FUND ADVISORS explains, low valuations mean value stocks currently have higher expected returns. But Dimensional’s own research shows that trying to time your entry in and out of value stocks is very difficult.
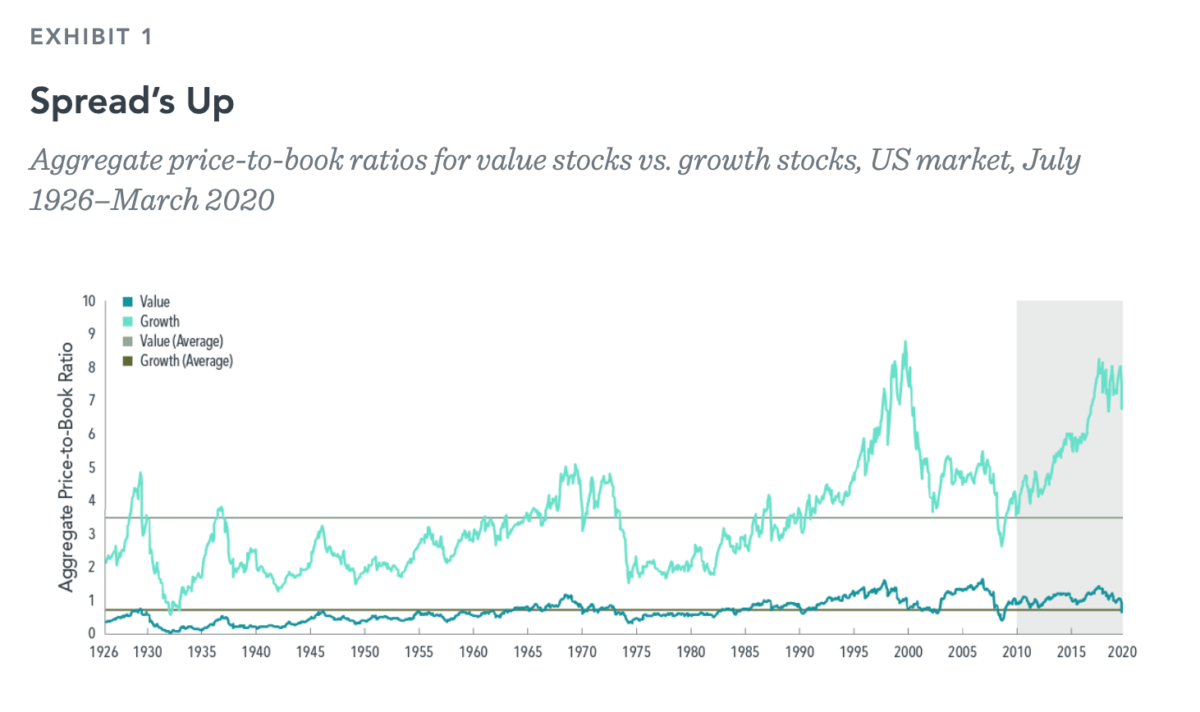
These have been challenging times for value stocks. Over the 10-year period ending March 31, 2020, the Fama/French US Value Research Index returned an annualized 5.06%. This is well behind the 13.04% achieved by the Fama/French US Growth Research Index. This performance divergence has resulted in a substantial widening of the price-to-book spread between value and growth stocks in the US, as shown in Exhibit 1.
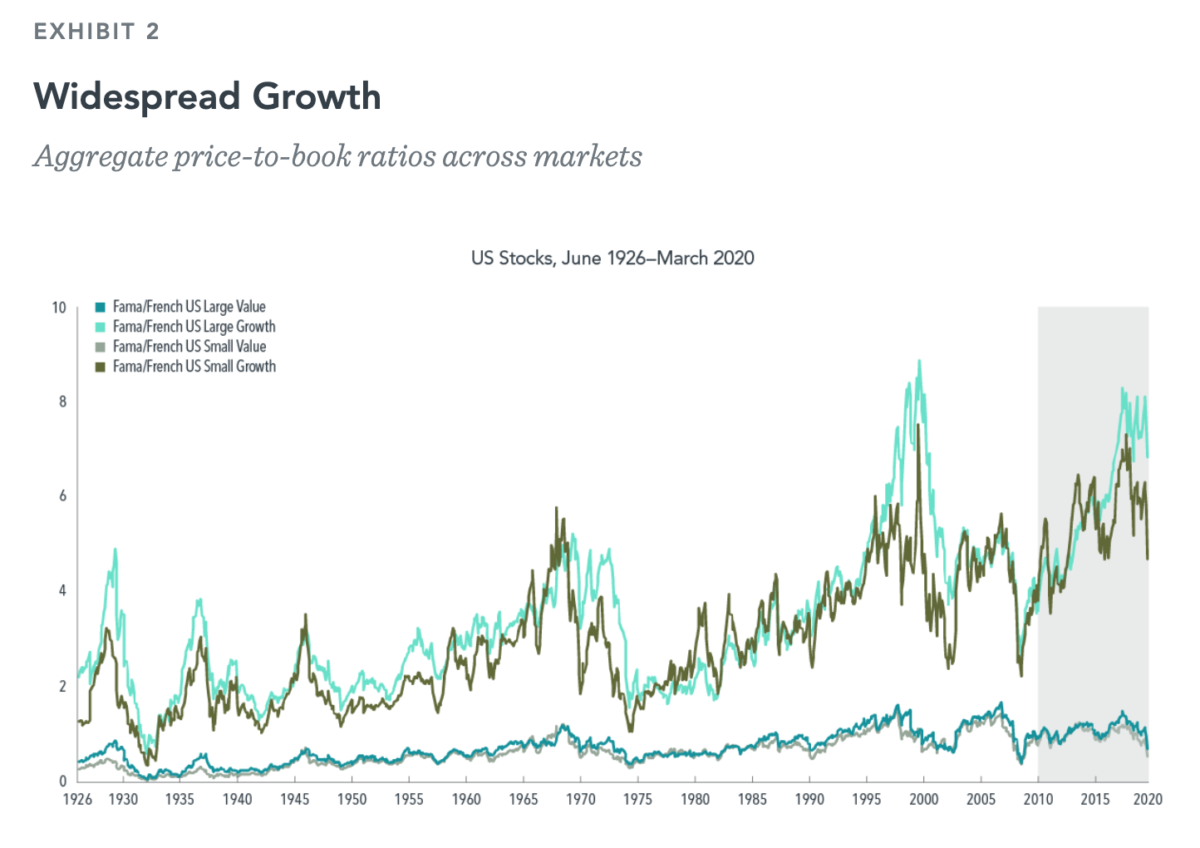
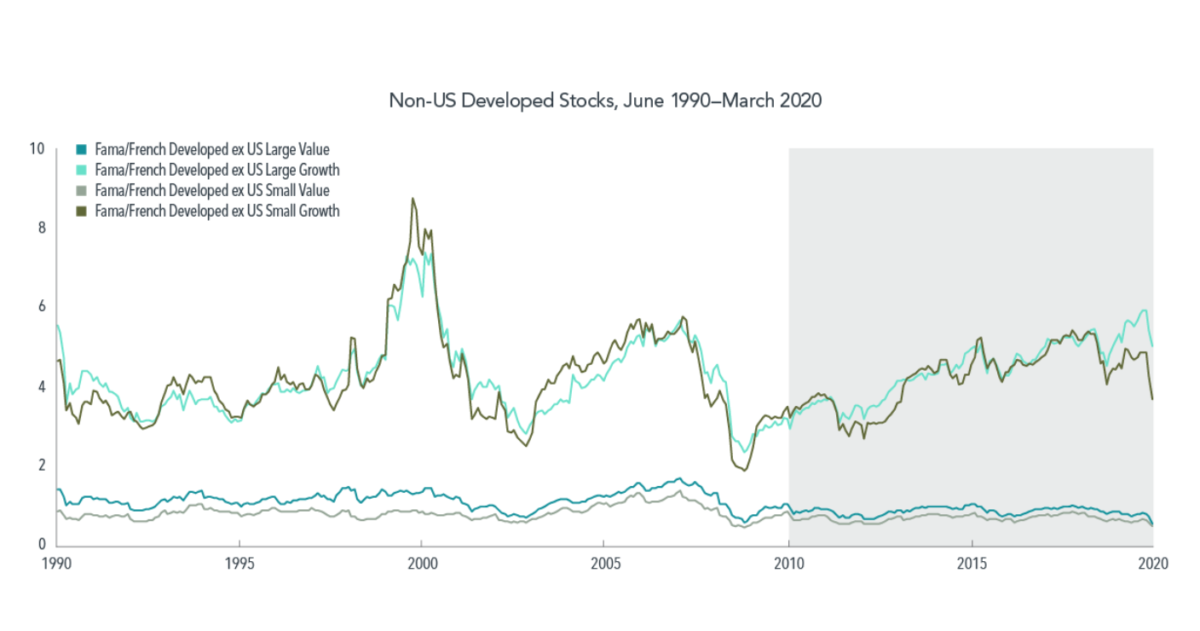
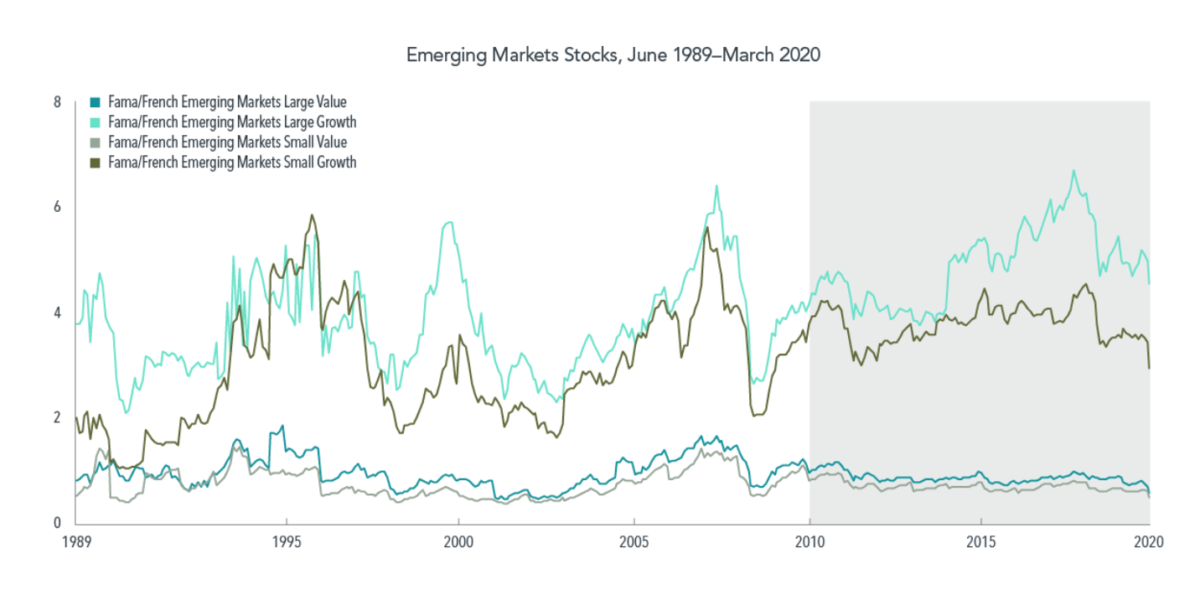
Similar trend across different markets
Extending this analysis to different markets and asset classes reveals further evidence of widening valuation spreads between value and growth. As we see in Exhibit 2, spreads among large cap stocks in the US, non-US developed, and emerging markets have all generally expanded over the past decade. This was also true for small cap stocks in the US and non-US developed markets. Only emerging markets small caps have bucked the spread-widening trend.
Low valuations mean higher expected returns
What do we make of the valuation ratio data? A stock’s price represents the value of a company’s expected future cash flows discounted back to the present. So low valuations can result from low expectations of future cash flows, high discount rates, or a mix of the two. It’s not possible to cleanly isolate cash flow and discount rate effects from the data. But to the extent that low valuations reflect high discount rates, expected returns will be higher going forward.
Changes in the valuation spread between market subsets, such as value versus growth, will then depend on the relative impact of cash flow and discount rate effects for each group of stocks. For example, if the market’s expectation for value stocks’ future cash flows declines more rapidly than its expectation for growth stocks, the spread in valuations between the two may widen. A similar effect may result if the discount rate for value stocks increases relative to the discount rate for growth stocks.
To the extent that widening spreads between value and growth are attributable to increases in the discount rates for value relative to growth, the implication would be a higher expected value premium.
Timing strategies usually fail
However, a white paper for Dimensional, published in 2016, Wei Dai says the evidence shows that investors should be cautious using valuation spreads as inputs for asset allocation decisions. Regression analysis provides some evidence of a link between valuation spreads and subsequent value premiums. However, hypothetical timing strategies that switch between value stocks and growth stocks based on the spread in their valuations fail to consistently outperform a simple buy-and-hold value strategy.
Takeaway for investors
What’s the takeaway for investors? Even if the spreads in valuations between value and growth vary through time, the important part is that there is a spread. Investors demand different expected returns across stocks, and that shows up in part through different valuations.
It’s reasonable to expect that securities with lower prices relative to fundamentals should have higher expected returns. Value premiums may not show up every day, year, or decade. But we believe maintaining consistent exposure to value stocks is the most robust approach for capturing the value premium, regardless of current valuations.
GLOSSARY
Price-to-book ratio: The ratio of a firm’s market value to its book value, where market value is computed as price multiplied by shares outstanding and book value is the value of stockholder equity as reported on a company’s balance sheet.
Value stock: A stock trading at a low price relative to a measure such as book value or earnings.
Value premium: The return difference between value stocks and growth stocks.
Growth stock: A stock trading at a high price relative to a measure such as book value or earnings.
Market capitalisation: The total market value of a company’s outstanding shares, computed as price times shares outstanding.
Discount rate: The rate of return that determines the present value of a company’s expected future cash flows.
Regression analysis: A statistical technique for estimating the strength of the relation between one variable and one or more other variables.
This article first appeared on the Dimensional Fund Advisors blog, Dimensional Perspectives.
Interested in more insights from Dimensional? Here are some more articles from this series:
What will the recession mean for small-cap stocks?
How worried should investors be about the recession?
Remember, you’ve trained for this
Study provides fresh insight on bond returns
The outsize rewards for owning the top-performing stocks
You can’t predict market movements: 2019 is a case in point