
The authors of a new study have suggested a new measure that could be made available to investors when selecting funds for their portfolio. It’s called active fee — the ratio between the excess cost of active management over the index alternative and the activity level of the fund. So, how useful could it be? LARRY SWEDROE takes a look.
Despite the growing popularity of passive investing, about half of mutual fund money is still actively managed. There is substantial literature on how investors choose actively managed funds that includes examining costs, past performance, performance versus asset pricing models, active share, Morningstar ratings and even advertising.
Trond Døskeland, André Sjuve and Andreas Ørpetveit contribute to the literature with their June 2021 study, Does Active Fee Predict Mutual Fund Flow? Price Sensitivity of Demand for Active Management. Their hypothesis was that investors act rationally when choosing among active funds using a measure called “active fee” — the ratio between the excess cost of active management over the index alternative and the activity level of the fund (its active share).
Active fee can be interpreted as the unit price of active management. The numerator, the excess fee, is how much the given amount costs, and the denominator, the activity level, is how many units of active management the investor gets. The lower the measure, the larger the upside potential of the active mutual fund. Their sample period was 2006-19 and included almost 40,000 funds from the Lipper database. Following is a summary of their findings:
- The active fee ranged from an average of 0.5 percent in the U.S. to 2.2 percent in Italy. The average level of active fee was 1.4 percent per year.
- For excess fee, the total cost of active management minus indexing, the global country average was 1 percent per year; the U.S. was the country with the lowest fee.
- The average fund had a negative yearly net flow of -2 percent and delivered a negative gross alpha of -83 basis points per year.
- There was a statistically significant (at the 1 percent confidence level) negative relationship between active fee and subsequent flows — there was negative price elasticity of demand for active management; a one standard deviation change in active fee resulted in a shift in net flow of 83.4 basis points. This effect implied a 42 percent change in the unconditional expected yearly flow.
- The time-series relation was driven by both the activity level and the excess cost of active management.
- The results held after controlling for Morningstar ratings.
- The effect was less important for large funds — investments in large funds are less sensitive to active fee.
Their findings led Døskeland, Sjuve and Ørpetveit to conclude:
“The relation between active fee and flow comes from both the excess fee and the activity level. Thus, we show that in a market where it is hard for both researchers and investors to identify what creates value for the investors, at least some investors use a ‘rational’ signal such as active fee. However, we argue that active mutual fund investors should have responded more than they did. It is not easy to regulate financial markets, but maybe active fee should be part of the investor information.”
They added that the disclosure of the active fee can help prevent closet indexing.
The use of active fee is rational, as it provides investors with the cost per unit of active management. The same rationale should be used by investors in index funds and other “passively” (systematically) managed funds. Too many investors in passively managed funds consider only the expense ratio without considering that even passively managed funds within the same asset class can have very different exposures to common factors that explain the vast majority of the differences in returns. Thus, return differences can be significant. Therefore, investors should consider the expense ratio per unit of exposure to common factors.
For example, consider Vanguard’s Small-Cap Value Index Fund (VSIAX), with an expense ratio of 0.07 percent, and Bridgeway’s Omni Small-Cap Value Fund (BOSVX), with an expense ratio of 0.47 percent. If one bases the investment decision solely on expense ratios, the clear choice would be VSIAX. However, as you can see in the following table, the funds have very different exposures to common factors with ex-ante (expected) premiums. Data is from Morningstar (4/30/21 for VIAX and 3/31/21 for BOSVX):
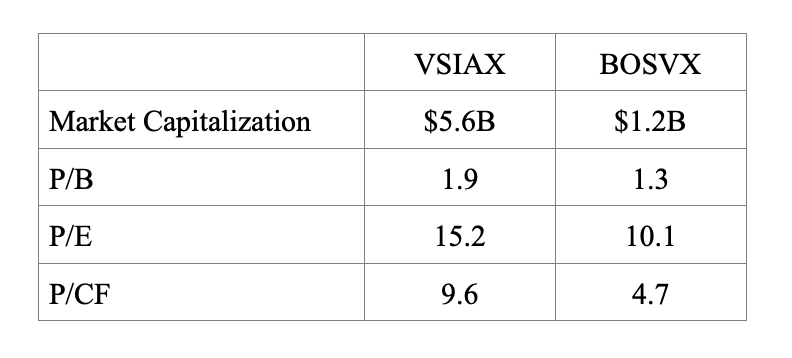
As you can see, VSIAX had almost five times the average market capitalisation of BOSVX, its price-to-book ratio was 46 percent higher, its price-to-earnings ratio was 50 percent higher, and its price-to-cash flow ratio was more than twice as high. Thus, the loadings for VSIAX on factors with historical premiums would be much lower than for BOSVX.
Using the regression tool at Portfolio Visualizer and the AQR factors, we see the following loadings (exposure) for four factors for the period September 2011 (inception date of BOSVX) through March 2021. Both funds have marginally positive exposure to the momentum factor:
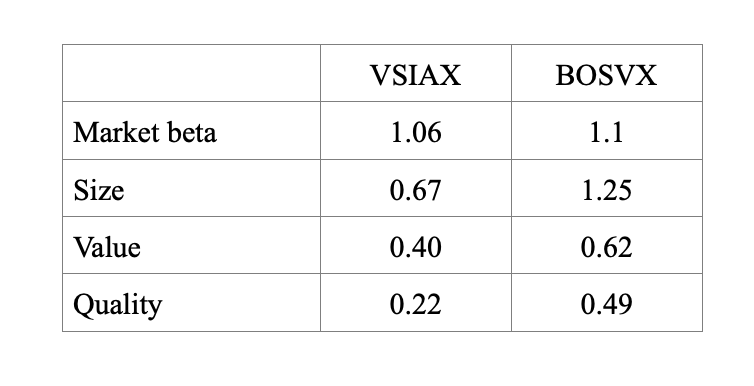
As you can see, the loadings on the four factors were higher for BOSVX. The higher loadings, with their higher ex-ante (expected) returns, should be considered relative to the difference in expenses — while keeping in mind that expenses are certain, while expected returns are not.
With that said, if we assume a market beta premium of even 5 percent, the 0.05 higher loading for BOSVX would add 0.25 percent to the expected return difference. Assuming a 2 percent size premium, the 0.58 higher loading would also add more than 1 percent in expected return differences; and the 0.22 difference in value loading (assuming a 3 percent value premium) would add about another 0.66 percent in expected return. The higher 0.27 loading on quality would also add another 0.5 percent to expected returns (assuming a quality premium of 2 percent).
Of course, if the factor premiums are negative in the future, BOSVX would be expected to underperform. However, that should not be the expectation.
Finally, factor loadings and expenses are not the only considerations for investors. When selecting a fund, you should also consider the fund’s trading strategy. Ask, for example, does it slavishly cling to an index and incur greater market impact costs? Or does it trade patiently using algorithmic programs?
Consider too the amount of diversification. For example, while for large-cap stocks a relatively small number (such as 100) might be acceptable, for small-cap stocks, we at Buckingham want to see at least 500 stocks because of the relatively lower correlation of returns among small stocks and their much greater dispersion of returns.
Important Disclosure: My firm, Buckingham Wealth Partners, recommends Bridgeway funds in constructing client portfolios. The information presented herein is for educational purposes only and should not be construed as specific investment, accounting, legal or tax advice. Certain information may be based on third party data which may become outdated or otherwise superseded without notice. Third party information is deemed to be reliable, but its accuracy and completeness cannot be guaranteed. Indices are not available for direct investment. Their performance does not reflect the expenses associated with the management of an actual portfolio nor do indices represent results of actual trading. Performance is historical and does not guarantee future results. By clicking on any of the links above, you acknowledge that they are solely for your convenience, and do not necessarily imply any affiliations, sponsorships, endorsements or representations whatsoever by us regarding third-party Web sites. We are not responsible for the content, availability or privacy policies of these sites, and shall not be responsible or liable for any information, opinions, advice, products or services available on or through them. The opinions expressed by featured authors are their own and may not accurately reflect those of the Buckingham Strategic Wealth® or Buckingham Strategic Partners® (collectively Buckingham Wealth Partners). LSR-21-105
LARRY SWEDROE is Chief Research Officer at Buckingham Strategic Wealth and the author of numerous books on investing.
ALSO BY LARRY SWEDROE
How to think differently about diversification
The impact of recency bias on equity markets
Passive growth makes it harder to generate alpha
Should you buy stocks with very negative recent returns?
Should investors we worried about US government debt?
PREVIOUSLY ON TEBI
Should you invest in a dividend ETF?
Stock market games in schools are harmful
More pearls of wisdom from Buffett and Munger
Finding the total cost of investing is almost impossible
The pension time bomb: how worried should we be?
OUR STRATEGIC PARTNERS
Content such as this would not be possible without the support of our strategic partners, to whom we are very grateful.
TEBI’s principal partner is Sparrows Capital, which manages assets for family offices and institutions and also provides model portfolios to advice firms. We also have a strategic partner in Ireland — PFP Financial Services, a financial planning firm in Dublin.
We are currently seeking partnerships in North America and Australasia with firms that share our evidence-based and client-focused philosophy. If you’re interested in finding out more, do get in touch.
© The Evidence-Based Investor MMXXI
Robin is a journalist and campaigner for positive change in global investing. He runs Regis Media, a niche provider of content marketing for financial advice firms with an evidence-based investment philosophy. He also works as a consultant to other disruptive firms in the investing sector.


