
By LARRY SWEDROE
The expected rate of growth in future cash flows plays a pivotal role in investment analysis and valuations. It is the faster rate of growth in those cash flows that results in higher valuations (higher P/E ratios) for growth stocks versus value stocks. Not only have growth stocks had higher rates of earnings growth — from July 1963 through June 2022, the Fama-French U.S. Growth Research Index had earnings per share growth of 9.6 percent per annum, 3.6 percentage points greater than the 6.0 percent growth rate of the Fama-French U.S. Value Research Index; they have also produced much higher returns on equity and returns on assets. From July 1963 through June 2022, the Fama-French research index of growth stocks produced an ROE (ROA) of 25.7 percent (11.0 percent) versus an ROE of 9.7 percent (4.0 percent) percent for the Fama-French research index of value stocks. However, despite having higher returns on equity and assets and higher rates of earnings growth, over the long term growth stocks have produced lower returns than value stocks. Over the period July 1926-August 2022, the Fama-French U.S. Growth Research Index returned 9.8 percent, underperforming the Fama-French U.S. Value Research Index, which returned 12.7 percent, by 2.9 percentage points per annum.
This result surprises many investors. Why have companies with worse financial performance outperformed companies with superior financial performance? The risk-based explanation is that value stocks are the stocks of riskier companies for which investors demand a premium. There is also a behavioral explanation. The value premium results from investors being too optimistic in projecting future earnings of growth companies. Judgmental biases (such as anchoring) may lead to a discrepancy between share valuations along with analysts’ predictions on the one hand and realized operating performance growth on the other.
Empirical findings
Keith Anderson and Tomasz Zastawniak, authors of the 2015 study Glamour, Value and Anchoring on the Changing P/E found that “glamour investors anchor on the high P/E value for glamour shares, while ignoring the high likelihood of future changes to the P/E ratio”. There is strong academic research supporting Anderson and Zastawniak’s evidence. For example, in their 1999 study Forecasting Profitability and Earnings, Eugene Fama and Kenneth French tested whether the theory of profitability reverting to the mean stood up to the historical data. They examined the profits from an average of 2,304 firms per year for the period 1964-1995 and found:
- There was a strong tendency for profits to revert to the mean.
- Reversion to the mean was strongest when profits were highest (the point at which the incentive is greatest for competition to enter an industry) and lowest (the point at which the incentive is greatest to leave an industry and reallocate assets, thereby reducing competition and restoring profits).
- Abnormally low earnings tended to revert even faster than abnormally high profits.
- Reversion to the mean occurred at a rate of about 40 percent per year.
- Real-world forecasts tended to underestimate the speed at which reversion to the mean in profitability occurred.
Fama and French offered a possible behavioral-oriented explanation for the finding that abnormally low earnings revert faster than abnormally high earnings. They hypothesised that when reporting bad news, companies often become very conservative and try to get all the bad news out of the way at one time (possibly blaming previous management). On the other hand, they tend to spread good news out over time.
If reversion to the mean of abnormal earnings occurs faster than the market is anticipating, growth stocks are likely to underperform value stocks. It seems the market may simply be overestimating the amount of time that growth firms are able to generate abnormal profits. Ultimately, earnings expectations are not met and get reflected in lower equity returns. The reverse is true of value firms. The market appears to overestimate the time it takes for abnormally low profits to revert to the mean. Ultimately, earnings expectations are exceeded and get reflected in higher returns.
Further evidence
Louis Chan, Jason Karceski and Josef Lakonishok, authors of the 2002 study The Level and Persistence of Growth Rates, analyzed historical long-term growth rates across a broad cross-section of U.S. stocks using several indicators of operating performance over the period 1951- 1997. They tested for both persistence and predictability in growth and found that while some firms have grown at high rates historically, they are relatively rare instances. For example, they found that only about 10 firms grew at a rate in excess of 18 percent per year over 10 years. They also found that there was no persistence in long-term earnings growth beyond chance; there was low predictability even with a wide variety of predictor variables; IBES (Institutional Brokers’ Estimate System) growth forecasts were overly optimistic and added little predictive power; and valuation ratios had limited ability to predict future growth. Their evidence provided support for the behavioral explanation accounting for at least some portion of the value premium.
Latest research
Thanks to Brian Chingono and Greg Obenshain of Verdad, we have an update to the evidence on the persistence of growth rates. They began by citing evidence of the persistence of growth assumption: “The Vanguard US Growth Index consists of companies that have grown their earnings by 28% on average over the past five years. These growth stocks are priced at 29x their trailing net earnings, a 52% premium to the overall US market’s 19x Price/Earnings ratio. The average company in the US market portfolio has increased earnings by 20% annually over the past five years, an impressive number that seems to warrant similar discount rates between the overall market and growth stocks.”
To determine if the same pattern of overestimating the persistence of growth existed out-of-sample, they examined all U.S. stocks between 1997 and 2022. As shown in the table below, for all four measures of growth, they found little to no evidence of persistence in earnings growth, beyond chance, over the long term.
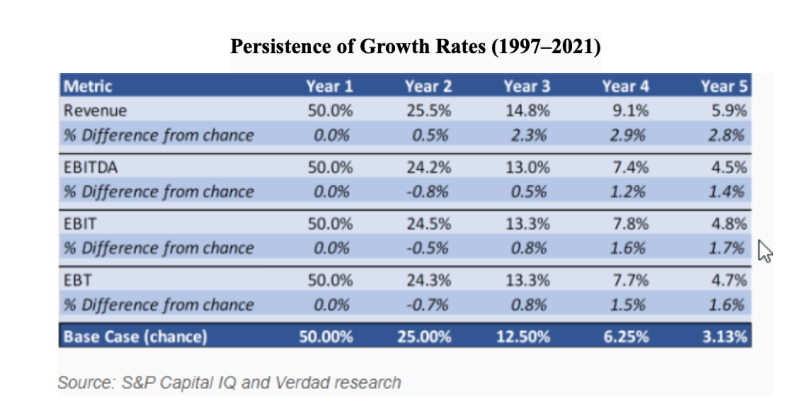
The above evidence suggests that the hypothesis that secular changes in the economy over the past two decades have changed the conclusion that earnings growth is not persistent beyond chance over the long term is false. In other words, it’s not different this time.
Chingono and Obenshain next asked: “What if we focus specifically on firms that have demonstrated the highest level of earnings growth in the past? Would the highest fliers of the past have a better chance of maintaining above-median growth in the future?” To answer this question, they adjusted their analysis by isolating firms that were in the top quartile of growth over the previous year. The table below presents the results:
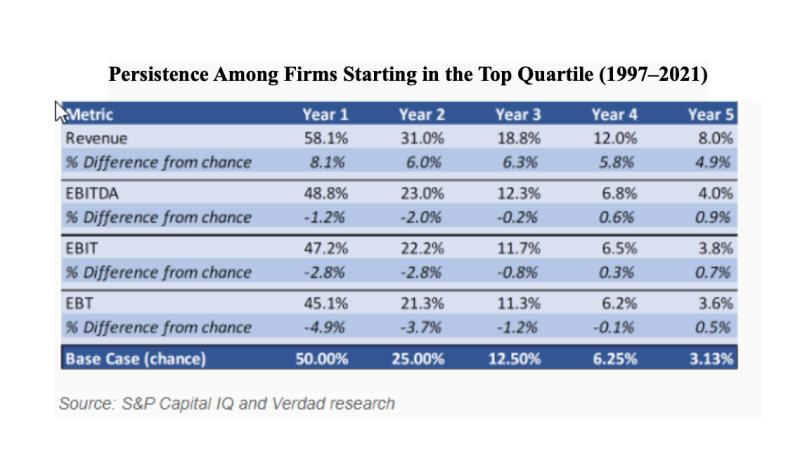
As you can see, when focusing specifically on past top-quartile performers, there was relatively more persistence in revenue growth. However, as we move further down the income statement toward earnings measures (what matter most for investors), any persistence beyond chance approached zero.
Since investors care most about cumulative growth rather than persistence of growth, Chingono and Obenshain also looked at cumulative growth over the next one to five years to determine if past winners continued to outgrow the market median on a cumulative basis.
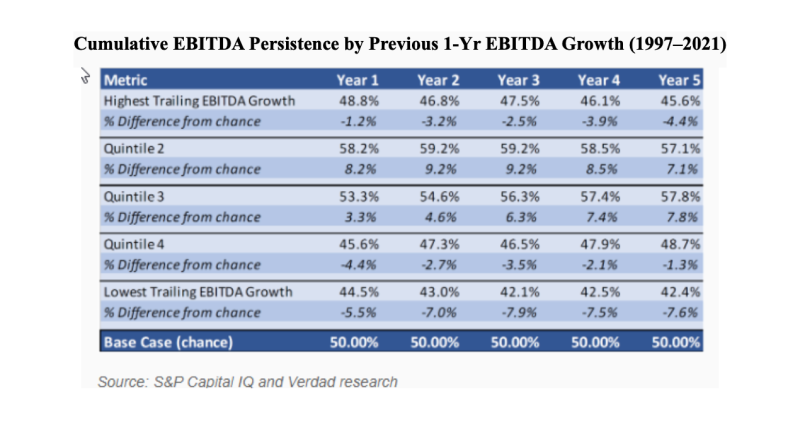
As you can see, the outcomes for the highest-trailing growth quintile are indistinguishable from the outcomes in the lowest-trailing growth quintile. Past winners essentially have the same long-term outcomes as past losers in terms of cumulative EBITDA (earnings before interest, taxes, depreciation and amortisation) growth.
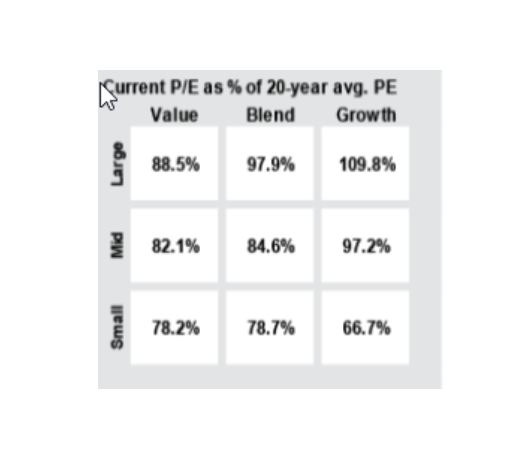
With the evidence in mind, we can examine the valuations as of September 30, 2022, of value and growth stocks relative to their 20-year average. While value stocks of all sizes are trading well below their 20-year average P/E ratio, large growth stocks are trading about 10 percent above their 20-year average P/E ratio, mid-cap growth stocks are trading at about their 20-year average, and small growth stocks are trading at about one-third below their 20-year average P/E ratio.
Investor takeaways
The historical evidence demonstrates that an investment strategy that bets on growth is a strategy likely to disappoint because growth is neither persistent nor predictable and because value stocks should have an embedded risk premium (noting that risks, of course, can and do show up).
It’s likely that the evidence presented won’t settle the debate about whether the value premium is risk- or behavioral-based (if the latter is the case, the value premium is a free lunch). However, the answer to the question doesn’t have to be black or white. Perhaps the value premium, while not being a free lunch (there’s plenty of evidence supporting a risk-based explanation), is at least a free stop at the dessert tray for those investors willing to accept their incremental economic cycle risk.
The bottom line is that value stocks historically have outperformed growth stocks, and if you think the explanation is risk-based, then you should expect this outperformance to continue. And if you think the explanation is behavioral-based, then unless you expect investor behavior to change, you should expect value stocks to outperform as well. Also remember that the outperformance of value stocks has been in the academic literature for many decades, and legendary investor Benjamin Graham was advocating for the purchase of value stocks 80 years ago.
For informational and educational purposes only and should not be construed as specific investment, accounting, legal, or tax advice. Certain information is based upon third party data which may become outdated or otherwise superseded at any time without notice. Third party information is deemed to be reliable, but its accuracy and completeness cannot be guaranteed. Indices are not available for direct investment. Their performance does not reflect the expenses associated with the management of an actual portfolio nor do indices represent results of actual trading. By clicking on any of the links above, you acknowledge that they are solely for your convenience, and do not necessarily imply any affiliations, sponsorships, endorsements or representations whatsoever by us regarding third-party websites. We are not responsible for the content, availability or privacy policies of these sites, and shall not be responsible or liable for any information, opinions, advice, products or services available on or through them. The opinions expressed by featured authors are their own and may not accurately reflect those of Buckingham Strategic Wealth® or Buckingham Strategic Partners®, collectively Buckingham Wealth Partners. Neither the Securities and Exchange Commission (SEC) nor any other federal or state agency have approved, determined the accuracy, and confirmed the adequacy of this article. LSR-22-393
LARRY SWEDROE is Chief Research Officer at Buckingham Strategic Wealth and the author of numerous books on investing.
ALSO BY LARRY SWEDROE
The performance of small value stocks over economic cycles
Has the rise of indexing made active outperformance even harder?
Is there a link between GDP growth and emerging market returns?
How do interest rates impact on REIT returns?
Do recency bias and loss aversion lead to mispricings?
CONTENT FOR ADVICE FIRMS
Through our partners at Regis Media, TEBI provides a wide range of high-quality content for financial advice and planning firms. The material is designed to help educate clients and to engage with prospects.
As well as exclusive content, we also offer pre-produced videos, eGuides and articles which explain how investing works and the valuable role that a good financial adviser can play.
If you would like to find out more, why not visit the Regis Media website and YouTube channel? If you have any specific enquiries, email Robin Powell, who will be happy to help you.
© The Evidence-Based Investor MMXXII


