
Throughout the 11-year bull market that began in 2009, we were repeatedly warned that the rising popularity of indexing, and exchange-traded funds in particular, would trigger the next stock crash. Not only that, some commentators said, the crash would be all the more severe because of the illiquidity caused by people trying to sell their ETFs all at once.
We’ve discussed this issue many times on TEBI and have repeatedly stressed that passive investing and trading ETFs are two completely different things. But what actually happened when markets plummeted in March and then went on a rollercoaster ride lasting several weeks?
As this new research paper from S&P Dow Jones Indices explains, far from causing and exacerbating the volatility we saw, ETFs in fact helped support liquidity, while also providing price discovery.
Key takeaways
— Secondary trading in credit markets has changed meaningfully in the last 10 years, including the retreat of traditional providers of liquidity, such as broker-dealers, and the rise of exchange-traded funds (ETFs).
— ETFs are playing an increasing role in providing secondary market liquidity, which was on display during the recent volatility.
— As both primary and secondary bond markets faced illiquidity, record ETF volumes helped to support liquidity and, importantly, provide price discovery.
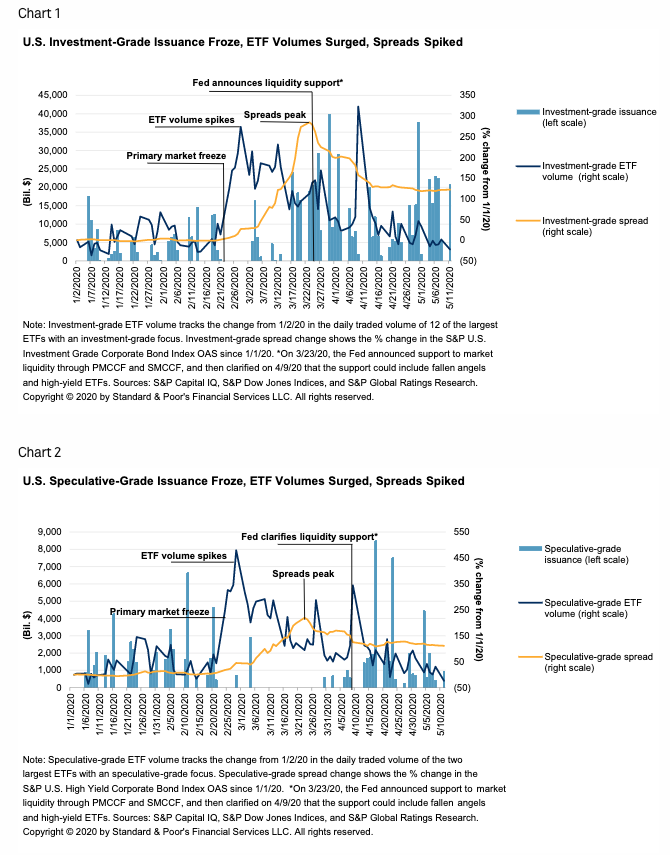
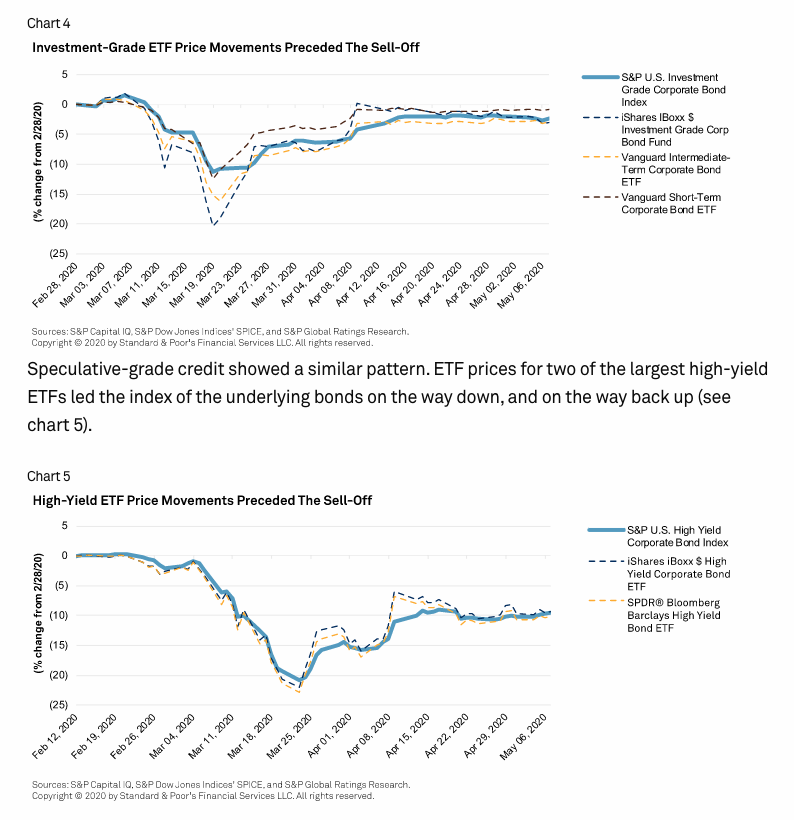
As the coronavirus pandemic accelerated across the globe in late February and March, liquidity quickly started to recede from both primary and secondary credit markets. Primary market issuance of both investment- and speculative-grade bonds came to a virtual standstill in late February–limiting companies’ ability to raise new funding for working capital or to refinance debt.
Secondary market trading increased yet was concentrated in a small share of the most liquid bonds. Bond spreads continued widening for both investment- and speculative-grade companies until the Fed announced on March 23 that it would step in to support liquidity in both the primary and secondary corporate credit markets.
Market conditions for speculative-grade issuance and pricing further rebounded after the Fed expanded its liquidity facilities to include fallen angels (issuers downgraded to speculative grade from investment grade) and high-yield exchange-traded funds (ETFs). However, while bond issuance dried up and spreads widened dramatically, fixed-income ETFs’ trading volumes spiked in late February and early March.
ETF trading volume reached a record as soon as primary markets shuttered and before the Fed made its initial announcement regarding corporate bond purchases.
The structure of secondary credit markets has changed following periods of stress
ETFs were created in the aftermath of the Oct. 19, 1987, market crash, following the SEC’s publication of “The October 1987 Market Break,” and their role has evolved in response to subsequent market events.
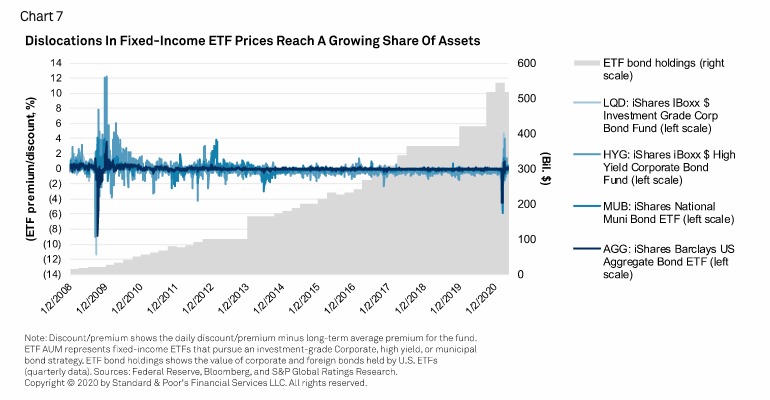
Following the global financial crisis, as broker-dealers stepped back from fixed-income market-making activities, fixed-income ETFs partially filled the void. This provides market participants (including retail investors and institutional investors such as portfolio managers, mutual funds, and insurance companies) with a way to trade credit assets on an exchange throughout the day and hedge credit exposure.
In mid-2007, broker-dealers held $418 billion in corporate and foreign bond assets that could be used for market-making activity, but now these holdings account for less than $60 billion.
In contrast, ETFs’ holdings of corporate bonds have increased by more than $500 billion since that time, according to data from the Federal Reserve.

ETF price moves preceded index moves
As the effects of the COVID-19 pandemic spread throughout financial markets, credit markets became dislocated.
The S&P U.S. Investment Grade and High Yield Corporate Bond Indices suffered their worst monthly returns since 2008, falling 6.1% and 12.5%, respectively.
Investment-grade ETF price declines preceded declines in the S&P U.S. Investment Grade Corporate Bond Index (see chart 4). Three of the largest investment-grade corporate bond ETFs each recorded a steeper price decline and rebound than the investment-grade index.
Trade volume for bonds spiked, ETF volumes spiked higher
Volumes spiked in nearly every asset class as the impact of the COVID-19 pandemic spread globally, but fixed-income ETFs saw a dramatic increase relative to the broad credit market. TRACE monthly volume data shows U.S. corporate trading surged 50% in March 2020 (see chart 6). During that same time, volumes of the largest fixed-income ETFs rose nearly 200%.
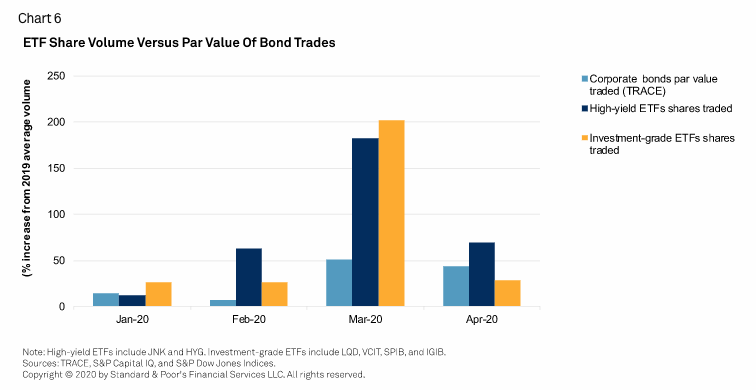
Many individual bonds seldom trade in the credit market, and the difference between trade volume and the total size of the bond market illustrates this. Monthly volume of all U.S. corporate bond trading surpassed $1 trillion in par value in 2020. The total size of the U.S. dollar credit market, measured by the S&P U.S. Dollar Global Investment Grade and High Yield Corporate Bond Indices, is close to $10 trillion in par value outstanding.
In March, more than half the bonds (by par value) in iShares iBoxx $ Investment Grade Corp Bond ETF (LQD) saw no trades in a given day, and a further 43% traded just one to five times a day, on average, (according to FINRA TRACE), while millions of LQD shares were traded daily. Even though ETF assets account for just around 5% of the total par value of U.S. corporate bonds, persistent trading of these shares over exchanges offered investors an alternate route to enter and exit the bond market.
With just a fraction of bonds traded in a given month, ETFs offered some market participants a means to trade bonds, without having to match buyers with sellers in a single bond. When the share prices of an ETF diverge from the net asset value (NAV) of the fund, then the authorised participants can use the create/redeem feature of an ETF to arbitrage the difference.
ETFs played a role in price discovery
During periods of acute stress or panic, both primary and secondary markets typically face sudden illiquidity. ETFs are not immune to this illiquidity, but the ease of trading and low transaction costs attract a high volume of trades from investors.
With ETF price moves preceding those of the underlying bond indices and preceding moves in credit spreads, ETFs appear to have brought more visibility to rapid and potentially sharper price movements. We believe this aided investors’ price discovery on the value of their underlying bond assets (both to the upside and the downside).
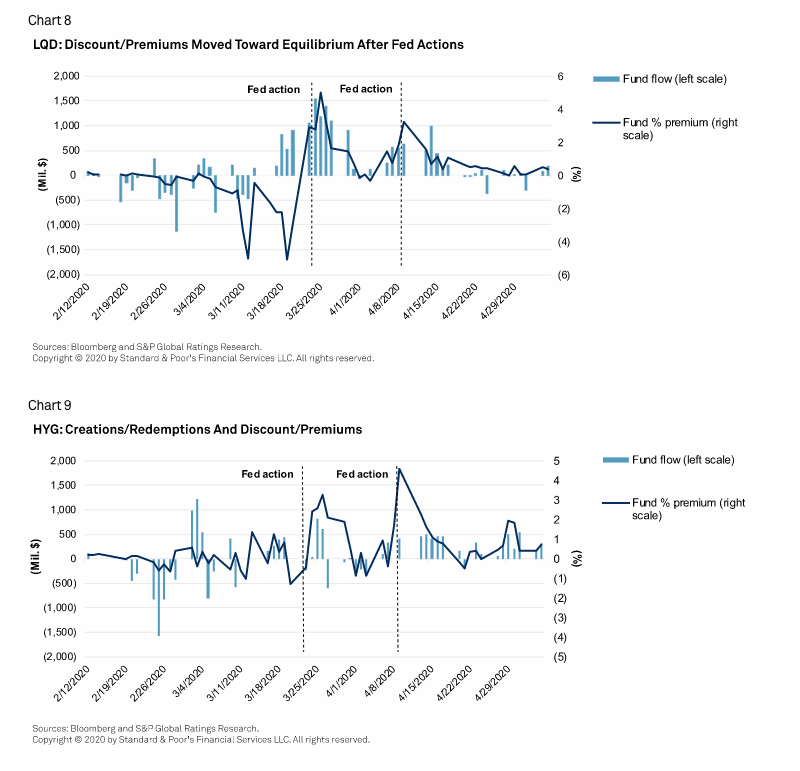
In March, steep discounts suddenly emerged in the price of some of the largest fixed income ETFs. This divergence between the ETF prices and NAVs led to the most pronounced ETF premiums and discounts since the global financial crisis. However, ETFs now play a larger role in credit markets than they did at that time.
There are a few structural factors that can help explain the difference between the price of ETFs and their NAVs during the market dislocation.
ETF prices reflect actual trades on an exchange, while prices for the underlying bonds are typically shown as “request for quote.” In the over-the-counter (OTC) market–where the advertised price can be fleeting if the trader showing the bid chooses to remove it.
There’s latency in the NAV calculation of the ETF. Price providers play a big role in NAV calculation and are often referred to as price “evaluators.” In addition to trades reported on a delay, the evaluated price may also include information such as dealer quotes, which may not move as fast as the market as dealer quotes may become stale or evaporate altogether.
In a normal functioning market–where underlying bonds can be traded at prices near those estimated by the evaluators–steep discounts, such as those we saw in corporate ETFs, can entice authorised participants (who can directly create or redeem ETF shares with the fund manager) to redeem shares of the ETF by handing shares over to the fund manager in exchange for a representative basket of bond assets that track the underlying index.
In this manner, the authorised participant picks up underlying assets at a discount (which they can then sell), and ETF shares are removed from the market, bringing the price of the ETF back to equilibrium with its underlying assets.
However, amid the market dislocation in March, these authorised participants were either unable, or unwilling, to step in with enough capacity to bring the ETF prices into equilibrium with those of the underlying bonds. We even saw inflows mount in some ETFs during March 17-20, despite the steep discounts, potentially as the ETFs provided investors with a faster and easier way to liquidate a bond position than the secondary market.
Rather than being forced to sell bond positions that had suddenly become illiquid, some participants appear to have used-fixed income ETFs to reduce or hedge risk exposure.
Equilibrium between ETF prices and NAV was only reached after the Fed announced its support for secondary market liquidity for investment grade on March 23, and later clarified on April 9 that this would include some recent fallen angels and high-yield ETFs, although this would not include ETFs trading at a material premium.
ETFs provided a point of entry and exit
In periods of market stress, liquidity can quickly disappear from both primary and secondary corporate credit markets. However, during the recent period of heightened volatility, we believe rising trade volume in fixed-income ETFs helped to offset some of this illiquidity.
As ETF trades exhibited rising volumes through the market dislocation, they could provide another avenue for investors to enter (as well as to exit) fixed-income positions. While liquidity from rising ETF trades was not enough to offset the absence of new issuance, the steady information provided by buyers and sellers of ETFs helped to provide some signals on price discovery in a dislocated market, which may in turn have aided market confidence and ultimately assisted in reopening primary markets.
Related research:
- The Growing Role Of Mutual Funds And Exchange-Traded Funds In The Credit Market, April 30, 2020
- How The Fed Changed The U.S. Corporate Funding Landscape, April 23, 2020
This report does not constitute a rating action.
This research paper is called Credit Trends: How ETFs Contributed To Liquidity And Price Discovery In The Recent Market Dislocation and was first published on the S&P Dow Jones Indices website. It is republished here with kind permission.
For more valuable insights from our friends at S&P Dow Jones Indices, you might like to read these other recent articles:
How long do top-quartile funds stay there?
Three hundred and twenty billion dollars
US fund managers flopped in the crisis
92% of Canadian fund managers underperformed in 2019
Does adjusting for risk make active performance any better?
How did Australian active managers handle Q1 volatility?
Want something else to read? Here are two related articles we think you’ll find interesting:
Did smart beta fixed-income ETFs pass the COVID test?
A critical look at the arguments against index investing
Picture: Caitlyn Wynne via Unsplash