
If you work in financial services or the financial media and you’re not yet familiar with the Morningstar Active/ Passive Barometer, it’s time to acquaint yourself with it. In fact that goes for anyone who wants to learn more about the hard evidence for using low-cost index funds.
The Barometer comes out twice a year and measures the performance of active managers against their passive peers within their respective categories. Its focus used to be on US-domiciled funds, but from now on Morningstar is also analysing performance in different parts of the world. Unlike SPIVA, which measures performance against an index, Morningstar’s scorecard looks at how active managers have fared relative to the actual, net-of-fees performance of comparable passive funds.
The latest Active/ Passive Barometer for the U.S has just been released. So what does it tell us? Morningstar’s BEN JOHNSON has been looking at the most important findings.
Just 49% of the nearly 3,500 active funds we cover survived and outperformed their average passive counterpart in 2020. This number isn’t far off from what it was when we assessed these funds in mid-2020, reinforcing the view we shared then: there’s little merit to the notion that active funds are more capable of navigating market volatility.
We further analyse these findings in the year-end 2020 instalment of the Morningstar Active/ Passive Barometer, a semiannual report that measures the performance of U.S. active funds against passive peers in their respective Morningstar Categories. The Active/Passive Barometer spans nearly 4,400 unique funds that accounted for approximately $15.9 trillion in assets, or about 67% of the U.S. fund market, as of the end of 2020.
You can learn more about the background on our approach to forecasting in this article. Here, I share more about why this methodology works and take a look at how active funds fared in 2020.
How the Barometer assesses funds
The Morningstar Active/ Passive Barometer is a semi-annual report that measures the performance of U.S. active managers against their passive peers within their respective categories. The Active/Passive Barometer report is unique in the way it measures active managers’ success relative to the actual, net-of-fees performance of passive funds rather than an index, which isn’t investable.
The central question the report seeks to answer is: If an investor were to select an actively managed fund at random from a category, what are the odds that fund will survive and outperform its passive peers in any given time period?
We measure active managers’ success relative to investable passive alternatives in the same category. For example, an active manager in the U.S. large-blend category is measured against a composite of the performance of its index mutual fund and exchange-traded fund peers (Vanguard Total Stock Market Index (VTSMX), SPDR S&P 500 ETF (SPY), and so on). Specifically, we calculate the equal- and asset-weighted performance of the cohort of index-tracking (“passive”) options in each category that we examine, and we use that figure as the hurdle that defines success or failure for the active funds in the same category. The magnitude of outperformance or underperformance does not influence the success rate. However, these data are reflected in the average return figures for the funds in each group, and the distribution of 10-year excess returns for surviving active funds, which we report separately.
We believe this is a better benchmark because it reflects the performance of actual investable options and not an index. Indexes are not directly investable. Their performance does not account for the real costs associated with replicating their performance and packaging and distributing them in an investable format. In addition, the success rates for active managers can vary depending on one’s choice of benchmark. For example, the rate of success among U.S. large-blend managers may vary depending on whether one uses the S&P 500 or the Russell 1000 Index as their basis for comparison. By using a composite of investable alternatives within funds’ relevant categories as our benchmark, we account for the frictions involved in index investing (such as fees), and we mitigate the effects that might stem from cherry-picking a single index as a benchmark. The net result is a fairer comparison of how investors in actively managed funds have fared relative to those who opted for a passive approach.
We measure each fund’s performance based on the asset-weighted average performance of all its share classes in calculating success rates. This approach reflects the experience of the average dollar invested in each fund. We then rank these composite fund returns from highest to lowest and count the number of funds whose returns exceed the equal-weighted average of the passive funds in the category. The success rates are defined as the ratio of the number of active funds that both survived and outperformed the average of their passive peers to the number of funds that existed at the beginning of the period. Given this unique approach, our field of study is narrower than others’, as the universe of categories that contained a sufficient set of investable index-tracking funds was fairly narrow 10 years ago. The number of categories we include in this study has expanded over time and will continue to grow.
We also cut categories along the lines of cost. Cost matters. Fees are the one of the best predictors of future fund performance. We have sliced our universe into fee quintiles to highlight this relationship.
Finally, we examine the distribution of 10-year excess returns among surviving funds across each of the 20 categories included in our analysis. The shape of this distribution varies widely across categories. In the case of U.S. large-cap funds, it skews negative, indicating that the penalty for picking an underperforming manager tends to be greater than the reward for finding a winner. The inverse tends to be true of the fixed-income and foreign-stock categories we examined, where excess returns among surviving active managers skewed positive over the past decade.
Most active managers couldn’t outrun the market’s dramatic swings
The coronavirus sell-off and subsequent rebound tested the narrative that active funds are generally better able to navigate market volatility than their index peers. At year-end 2020, just 49% of the nearly 3,500 active funds included in our analysis survived and outperformed their average passive counterpart–not much of a change from our midyear report, in which 51% of active funds both survived and outperformed their average index peer during the first half of the year.
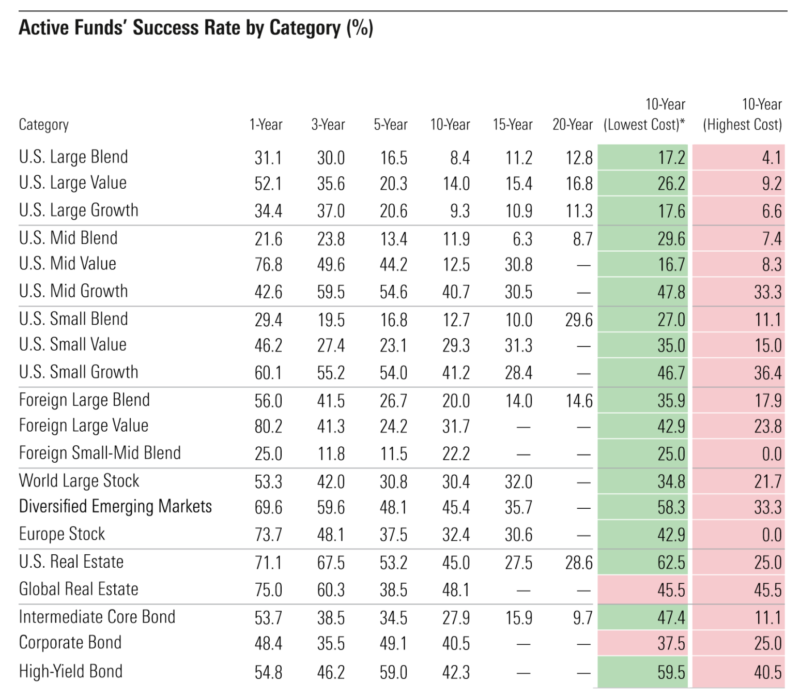
It was a difficult year for actively managed U.S. stock funds. Active funds’ one-year success rates slipped in seven of the nine categories that constitute the Morningstar Style Box. Just 42% of active funds in these categories outperformed the average of their passive competition in 2020, down from 49% in 2019. Success rates across active U.S. large-cap funds were flat versus 2019, landing at 38%. Meanwhile success rates among actively managed mid- and small-cap funds slipped. Mid-cap managers’ one-year success rate fell 19 percentage points to 46%, while small-cap managers’ one-year success rate fell 14 percentage points to 45%.
Value had an awful year, while growth had a great one. The Morningstar US Value Index lost 2.3% in 2020. The Morningstar US Growth Index gained 44.4%. The spread between the two styles’ performance is evident in active stock-pickers’ 2020 success rates. Active value managers’ beat rates jumped 14 percentage points in 2020 to 56% as their more-style-pure index competitors struggled. Success rates among growth-oriented managers dropped 16 percentage points relative to 2019, as their style-faithful passive peers got a lift from growth stocks’ searing-hot performance.
The one-year success rate for active funds in the intermediate core bond category jumped 17 percentage points versus 2019, clocking in at 53.7%. This figure was also 14 percentage points higher than what these funds registered through the first six months of 2020. The post-COVID-crisis rebound in credit markets was favorable for active funds in the category, which tend to take more credit risk than their indexed peers.
In general, actively managed funds have failed to survive and beat their benchmarks, especially over longer time horizons; only 23% of all active funds topped the average of their passive rivals over the 10-year period ended December 2020; long-term success rates were generally higher among foreign-stock, real estate, and bond funds and lowest among U.S. large-cap funds.

Disclosure: Morningstar, Inc. licenses indexes to financial institutions as the tracking indexes for investable products, such as exchange-traded funds, sponsored by the financial institution. The license fee for such use is paid by the sponsoring financial institution based mainly on the total assets of the investable product. Please click here for a list of investable products that track or have tracked a Morningstar index. Neither Morningstar, Inc. nor its investment management division markets, sells, or makes any representations regarding the advisability of investing in any investable product that tracks a Morningstar index.
BEN JOHNSON is director of global ETF research for Morningstar and editor of Morningstar ETFInvestor, a monthly newsletter. This article was first published on the Morningstar blog.
MORE FROM MORNINGSTAR
Which is best for corporate bonds — active or passive?
Three things to remember about emerging markets
Will ETFs overtake mutual funds?
What happens AFTER fund managers crush it?
The problem with stocks like Tesla
The most over- and under-hyped benefits of ETFs
PREVIOUSLY ON TEBI
After Cowspiracy and Seapspiracy, is it time for Fundspiracy?
The ESG momentum trade is fraught with danger
The uncanny parallels between Neil Woodford and Bill Gross
Sustainable investing is about returns we may never notice
Do investors allocate optimally to ETFs?
There’s more to life than trading stocks
VIDEO MARKETING FOR ADVISERS
Through our partners at Regis Media, TEBI provides a wide range of video content for financial advice and planning firms.
For firms in the UK, we can either come to you, or you can come to Regis Media’s studios in Birmingham, where we have a full white-screen set-up with lights and autocue. For firms outside the UK, we’re happy to talk through the options with you.
If it’s educational content you’re looking for, we have more than 200 pre-produced videos which can be tailored to include your branding, contact details and call-to-action.
Interested? Email Sam Willet, who will be happy to help you.
© The Evidence-Based Investor MMXXI
Robin is a journalist and campaigner for positive change in global investing. He runs Regis Media, a niche provider of content marketing for financial advice firms with an evidence-based investment philosophy. He also works as a consultant to other disruptive firms in the investing sector.


