
Much attention has been given in recent years to the so-called FAANG stocks — hugely successful firms like Facebook and Amazon which have been dominating the US stock market. But how can their extraordinary performance be explained? A new study explores the link between the success of “superstar” stocks and low interest rates. Has the low-interest-rate environment contributed to the FAANG phenomenon? If so, given that we appear to be heading for higher interest rates in the future, what does that tell us, if anything, about whether the dominance of the FAANG stocks will continue? LARRY SWEDROE investigates.
The extraordinary performance of the FAANG (Facebook, Amazon, Apple, Netflix and Alphabet, formerly known as Google) stocks over the past decade have led many investors to conclude that “this time it’s different” — these stocks will continue their strong performance going forward. Their outperformance has led to the top 10 U.S. stocks making up 24.5 percent of the total market capitalisation as of the end of the third quarter 2021. The outperformance of these superstar companies has led to a search for an explanation for their outperformance.
Thomas Kroen, Ernest Liu, Atif Mian and Amir Sufi contribute to the literature with their October 2021 study, Falling Rates and Rising Superstars, in which they examined the empirical relationship between economy-wide interest rates and the rise of superstar firms in the U.S. using the merged CRSP-Compustat data set from 1962 to 2019. They analysed the stock market reaction to an interest rate decline for industry leaders versus industry followers, defining the top five percent of firms by value in an industry as “leaders” and the rest as “followers”. They then constructed a “leader portfolio” that goes long industry leaders and shorts industry followers, and examined the portfolio’s performance in response to changes in the 10-year U.S. Treasury rate.
Following is a summary of their findings:
- Falling interest rates disproportionately benefit industry leaders, especially when the initial interest rate is already low.
- Falling rates raise the valuation of industry leaders relative to industry followers, and this effect snowballs as the interest rate approaches zero. The snowballing effect is not mechanically driven by industry leaders having higher duration (higher P/E ratio).
- The effect tends to be stronger when the interest rate change is computed over longer horizons — it is a more persistent decline in interest rates that boosts the value of the leaders relative to the followers.
- The return of the leader-minus-follower portfolio is negatively correlated with P/E ratios — lower rates impact relative valuations not only through changing the discount rate but also through the changes in future cash flows that favor the current leader.
- A 10 basis point reduction in the 10-year rate when it is 2 percent translates into a 0.53 percentage point larger increase in the market valuation of industry leaders relative to industry followers.
- The effect of a change in interest rates starts quickly, but the full effect is not realized until about 90 days. Further, there is no evidence of reversal over the following quarter.
- A 10 basis point decline in the 10-year rate when it is 2 percent leads to a 14 basis point relative decline in the borrowing cost of industry leaders relative to followers. When the initial rate is very close to the lower zero-bound, a 10 basis point decline leads to a 24 basis point relative decline.
- There are multiple channels through which falling rates disproportionately benefit industry leaders: (1) the cost of borrowing falls more for industry leaders, (2) industry leaders are able to raise more debt, increase leverage and buy back more shares, and (3) capital investment and acquisitions increase more for industry leaders.
- Their findings were robust to defining industry leaders by EBITDA (earnings before interest, taxes, depreciation and amortisation) and sales as well as to the use of shorter- or longer-term bond yields (with some evidence that longer-term yields are more important).
Their results led the authors to conclude: “The findings provide empirical support to the idea that extremely low interest rates and the rise of superstar firms are connected.” They explained that their results on investment provide empirical support to the theory that industry leaders respond more aggressively to a decline in the interest rate in order to “go for the kill”, including being more likely to target rivals with cash acquisitions in order to ensure their claim on the more valuable future cash flows.
Summing up, the authors stated: “The findings provide empirical support to the idea that extremely low interest rates may be a culprit in explaining the rise of superstar firms in the U.S. economy.”
What are the takeaways for investors?
Investor takeaways
First, it seems likely that we are at the end of the economic regime of falling interest rates, which the research found benefited industry leaders to the detriment of followers. The 10-year yield bottomed out on August 4, 2020, at 0.52 percent and as of this writing (October 21, 2021) stood at about 1.7 percent. Thus, industry leaders no longer have that tailwind at their backs and may be facing a headwind.
Second, investors should always keep in mind that expectations about the future operational performance of a firm are already reflected in its current price. Thus, while positive developments for a company that exceeds expectations (they are unexpected) may lead to further appreciation of its stock price, by definition those unexpected changes are not predictable.
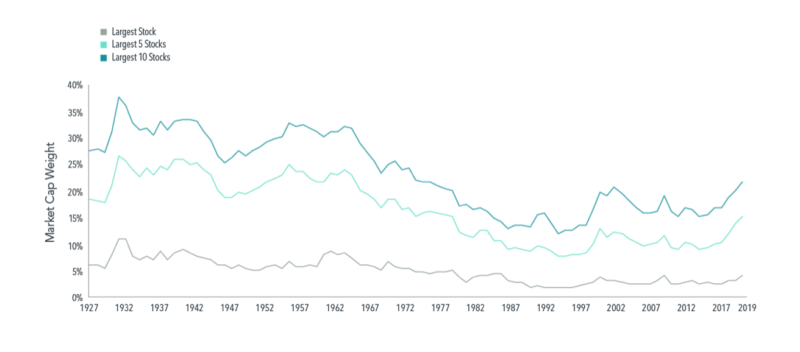
Third, investors should be aware that a top-heavy market is not unusual. As Dimensional noted in their June 2020 article, Large and In Charge, the largest 10 stocks accounting for over 20 percent of market capitalisation and a marquee technology firm perched at No. 1 is nothing new. For example, while Apple makes up 4.7 percent of the current U.S. market, in 1967 IBM represented a much larger 5.8 percent of the market. And as you can see in the following chart, for the period 1927 through the mid-1960s, the top 10 stocks persistently accounted for more than 25 percent of the market cap. Their share dropped to about 15 percent in the mid-1990s before rising again and reaching its current level. (As you review the chart, keep in mind that prior to 1973, when Nasdaq stocks were included, far fewer stocks were in the full CRSP database.)
Dimensional went on to show that it has not been unusual for some companies to stay on top for a long time. AT&T was among the largest two for six straight decades beginning in 1930. General Motors and General Electric ranked in the top 10 at the start of multiple decades. IBM and Exxon were also mainstays in the second half of the 20th century. Hence, concentration of the stock market in a few large companies such as the FAANG stocks in recent years is not a new normal; it is old normal.
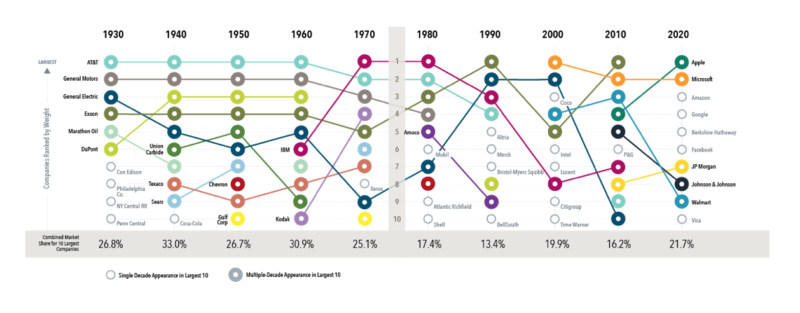
The question for investors is: How do these stocks perform once they reach the top ten? Dimensional found that over the next five years they went on to underperform the market by 1.1 percent, and over the next ten years they underperformed by 1.5 percent.
These examples explain why one of my favourite expressions is that there is nothing new in investing, just the investment history you don’t know. And it remains impossible to systematically predict which large companies will outperform the stock market and which will underperform it. This underscores the importance of having a broadly diversified equity portfolio that provides exposure to a vast array of companies and sectors.
This article is for informational and educational purposes only and should not be construed as specific investment, accounting, legal, or tax advice. Certain information is based on third party data which may become outdated or otherwise superseded without notice. Third party information is deemed to be reliable but its accuracy and completeness cannot be guaranteed. By clicking on any of the links above, you acknowledge it solely at your convenience and does not necessarily imply any affiliations, sponsorships, endorsements or representations whatsoever by us regarding third-party websites. We are not responsible for the content, availability, or privacy policies of these sites, and shall not be responsible or liable for any information, opinions, advice, products, or services available on or through them. Neither the Securities and Exchange Commission (SEC) nor any other federal or state agency have approved, confirmed the accuracy, or determined the adequacy of this article. The opinions expressed by featured authors are their own and may not accurately reflect those of the Buckingham Strategic Wealth® or Buckingham Strategic Partners®, collectively Buckingham Wealth Partners. LSR-21-177
LARRY SWEDROE is Chief Research Officer at Buckingham Strategic Wealth and the author of numerous books on investing.
ALSO BY LARRY SWEDROE
Business leaders and clergy more likely to panic sell
Front-running — a hidden risk in hedge funds
Quality, the flip side of value
Value stocks remain very “cheap” compared to growth
How can you hedge against inflation?
What to do if you’re worried about inflation
PREVIOUSLY ON TEBI
Learning to say no is key to a fulfilling life
Emerging markets: what investors need to know
A good job requires more than a good salary
Active managers failed their Covid test — Morningstar
It’s a great time to be an investor
Global warming puts heat on banks
CONTENT FOR ADVICE FIRMS
Through our partners at Regis Media, TEBI provides a wide range of high-quality content for financial advice and planning firms. The material is designed to help educate clients and to engage with prospects.
As well as exclusive content, we also offer pre-produced videos, eGuides and articles which explain how investing works and the valuable role that a good financial adviser can play.
If you would like to find out more, why not visit the Regis Media website and YouTube channel? If you have any specific enquiries, email Sam Willet, who will be happy to help you.
© The Evidence-Based Investor MMXXI
Robin is a journalist and campaigner for positive change in global investing. He runs Regis Media, a niche provider of content marketing for financial advice firms with an evidence-based investment philosophy. He also works as a consultant to other disruptive firms in the investing sector.


