
Although they shouldn’t be, investors are hugely impressed by past performance. So fund management companies choose which funds they’re going to promote and advertise very carefully. Not only that, they also pay close attention to the time frame they use when quoting a fund’s track record. CRAIG LAZZARA shows just how easy it is to make your past performance look better than than it is — and still be completely truthful.
As a potential investor, would you be impressed by the pattern of fund returns summarised in Exhibit 1? (I would be.)
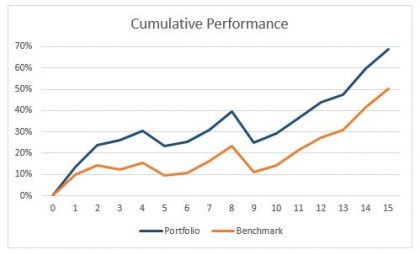
Over the course of 15 years, the portfolio in question notched a total return of 69%, versus only 50% for its benchmark. The accumulation of added value seems reasonably steady, and the portfolio doesn’t appear to be substantially more volatile than the benchmark, an impression that’s confirmed by the annual data in Exhibit 2.
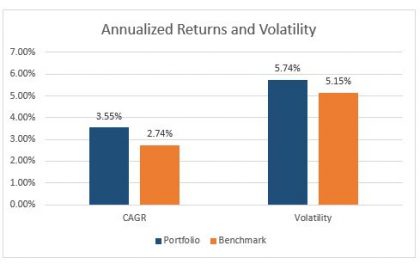
The portfolio generated 0.62 units of return for every unit of volatility, while the benchmark’s return/risk ratio was 0.53. Not only did the portfolio outperform in absolute terms, in other words, it also outperformed after adjustment for risk.
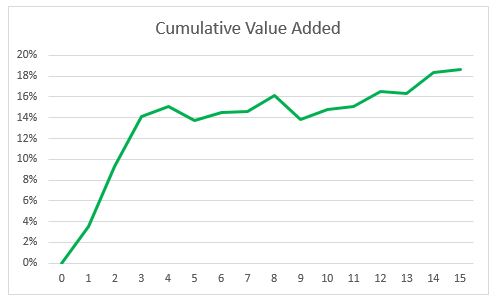
One of your colleagues is as impressed as you are with value added shown by Exhibits 1 and 2. He’s so impressed, in fact, that he prepares Exhibit 3, the better to admire the accumulation of alpha.
The fabric begins to unravel
If we pull on this thread, the fabric begins to unravel. The cumulative value added shown in Exhibit 3 — roughly 19% — is consistent with the total returns we observed in Exhibit 1. But now it becomes clear that the majority of the value added came very early in our 15-year history. What’s going on? Exhibit 4 illuminates the issue by showing annual, rather than cumulative, value added.
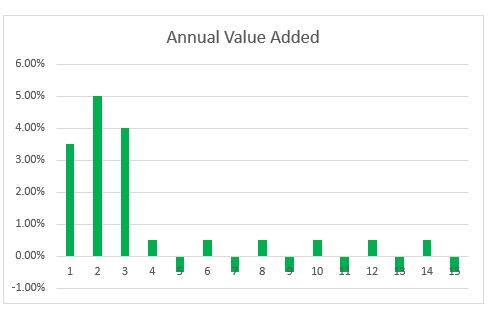
For the first three years, the portfolio handily outperformed its benchmark. For the subsequent 12 years, its value added was exactly zero — positive 50 basis points one year and negative 50 basis points the next. After year three, the portfolio and the benchmark rose by almost exactly the same amount. Although no new value added was generated, the initial margin is algebraically certain to increase as long as the market goes up.
Accurate and misleading at the same time
As with many things in performance accounting and fund marketing, data can be accurate and misleading at the same time. Exhibit 1, though accurate, gives the impression that the portfolio’s managers have added value steadily for the last 15 years.
Exhibit 4 reveals that their value-adding days ended more than a decade ago. As we’ve advised before, whenever you examine a performance history, disaggregate. If the value added is real, it will show up in annual or quarterly numbers. If it’s not real, it might still appear in cumulative returns. Users of more granular data are less likely to be misled.
CRAIG LAZZARA is Managing Director and Global Head of Index Investment Strategy at S&P Dow Jones Indices.
This article was for first posted on the Indexology blog and is republished here with permission.
For more valuable insights from our friends at S&P Dow Jones Indices, you might like to read these other recent articles:
Active or passive — which is more volatile?
How long do top-quartile funds stay there?
Three hundred and twenty billion dollars
US fund managers flopped in the crisis
92% of Canadian fund managers underperformed in 2019
Does adjusting for risk make active performance any better?
Did you enjoy this article? Here are recent posts you may have missed which we think you will find interesting:
Active or passive — which is more volatile?
Was it ETFs that cause the markets to blow?
Safe yield RIP. What are your options now?
Seven simple rules of investing
Picture: Julius Drost via Unsplash


