
With just two months to go until the US Presidential election, we can expect plenty of speculation in the coming weeks about the likely impact on the financial markets. Also watch out for salespeople masquerading as experts, eager to exploit our hopes and fears by persuading us to invest in a particular fund.
Basing an investment decision on which candidate you think will win is a foolish and dangerous strategy.
So what has happened to the markets in previous election years, both before and after polling day? HAMISH PRESTON from S&P Dow Jones Indices has been running the numbers on the S&P 500.
2020 has certainly been an extremely unusual year as economies, companies and individuals have grappled with the impacts of COVID-19. Although this year’s market movements have arguably been even more difficult to predict than usual, and many active managers were wrong-footed earlier this year, investment outlooks have kept at least one eye on the outcome of one extremely well-telegraphed event — the U.S. Presidential election. With November’s election less than three months away, what is the S&P 500®’s historical record around U.S. elections?
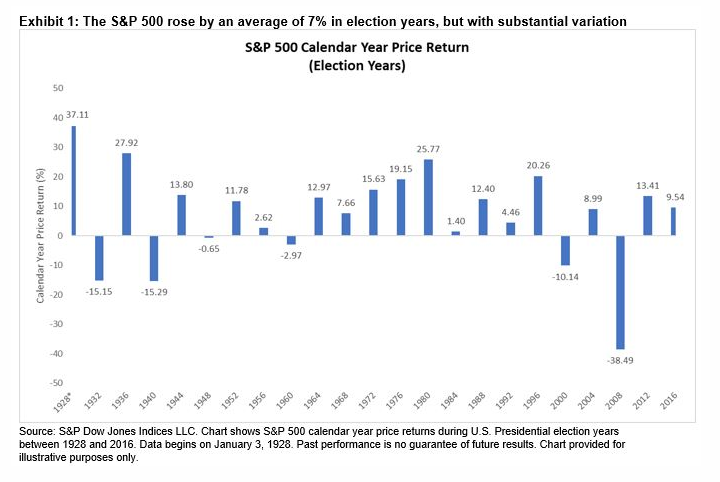
Exhibit 1 shows that the S&P 500 typically rose during U.S. Presidential election years: the benchmark posted a positive price return in 17 of the last 23 election years, giving it a hit rate of roughly 74% and an average return of 7.05%. But there was substantial cross-sectional variation in election returns: there was a return spread of over 75% between the S&P 500’s best election year (1928) with its worst (2008).
Are election years really that different?
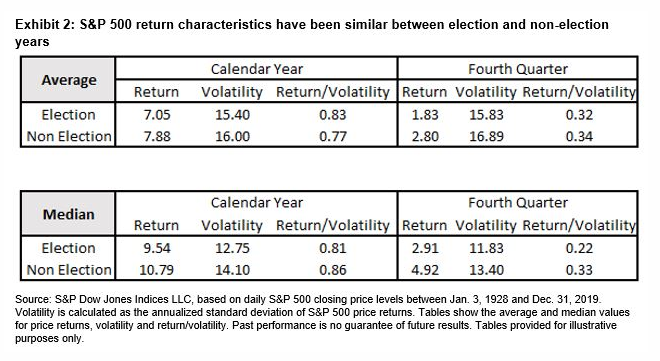
Before anyone uses Exhibit 1 to make inferences about the potential impact of the 2020 election on the S&P 500, it is important to recognise that the performance of the S&P 500 during election years has typically been similar to its performance during other years.
Exhibit 2 shows that the average (and median) calendar year S&P 500 price return, volatility and risk-adjusted returns have been similar across election and non-election years. Similar results were also observed during the fourth quarter, albeit with slightly greater differences.
The main impact is at sector level
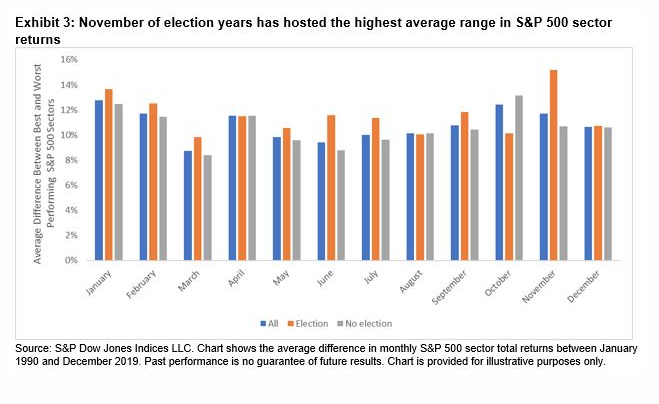
Although it can be difficult to identify a clear impact of U.S. Presidential elections at a market level, there appears to have been considerable impact at a sector level. Exhibit 3 shows the average range in monthly S&P 500 sector returns — calculated as the best-performing sector minus the worst performing sector — between 1990 and 2019.
The highest average range (15.18%) was observed in November during election years, far above the 10.8% average difference across all months. Notwithstanding the relatively small sample size, this suggests that election impacts were typically observed when investors priced-in the anticipated impact of the election winner’s policies on different market segments.
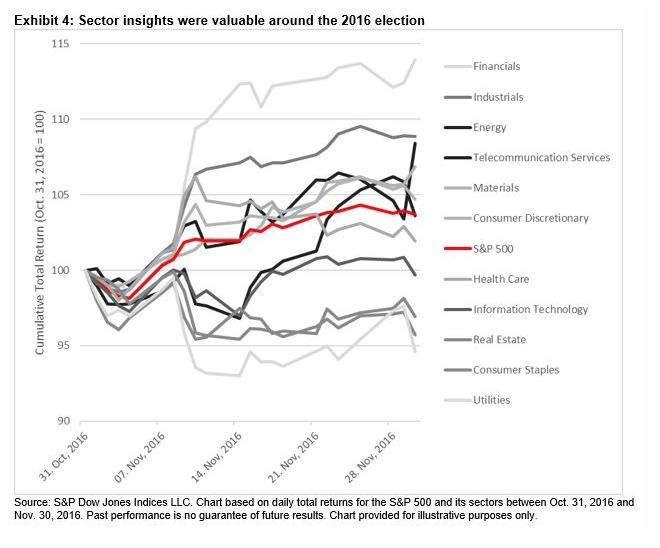
Financials vs utilities in 2016
One recent example of this dynamic came in the 2016 election. While the S&P 500 rose around 4% in November 2016, a whopping 19.34% separated the best-performing sector (Financials) and the worst-performing (Utilities). Hence, correctly identifying who would win the 2016 Presidential election and the anticipated sector impact offered considerable value in 2016.
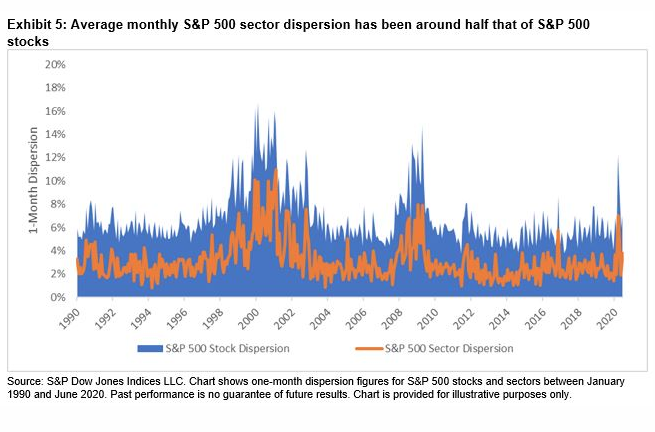
As a result, although the S&P 500 has been unperturbed by election outcomes, historically, evidence suggests it may be worthwhile to consider the potential benefits of using sectors to express views. Indeed, not only can picking sectors offer around half the potential value of stock-picking — Exhibit 5 shows that the average monthly S&P 500 sector dispersion (3.08%) was around half the average S&P 500 stock dispersion (6.77%) — but S&P 500 sectors have offered greater capacity for investors looking to express views.
HAMISH PRESTON is Associate Director, US Equity Indices, at S&P Dow Jones Indices. This article was first published on the Indexology blog.
The views expressed are not necessarily those of The Evidence-Based Investor, and none of our content should be seen as advice.
For more valuable insights from S&PDJI, you might like to read these other recent articles:
Another magic trick fund marketers play
Active or passive — which is more volatile?
How long do top-quartile funds stay there?
Three hundred and twenty billion dollars
US fund managers flopped in the crisis
92% of Canadian fund managers underperformed in 2019
Does adjusting for risk make active performance any better?
FIND AN ADVISER
Are you looking for an evidence-based financial adviser? We can help you find one. Click here for more details.
Picture: Library of Congress via Unsplash


