
By CRAIG LAZZARA from S&P Dow Jones Indices
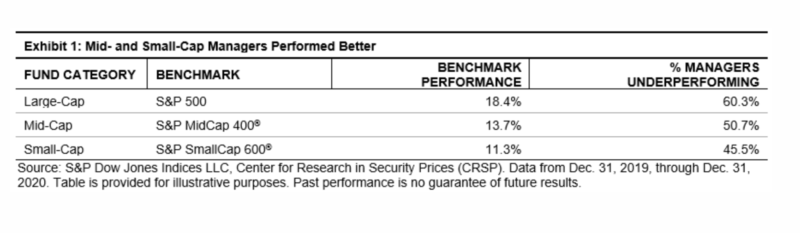
Last week S&P Dow Jones Indices released its SPIVA® U.S. Year-End 2020 Scorecard. As has been the case for 17 of the past 20 calendar years, the majority of active large-cap managers underperformed the S&P 500®. Performance was better for mid- and small-cap managers, as Exhibit 1 shows. What caused the advantage for smaller-capitalisation strategies?
Style bias supplies part of the answer. We refer to “style bias” as any systematic tendency in an actively-managed portfolio. For example, if a portfolio habitually tilts toward growth stocks, we’d refer to this tilt as a growth bias. (This is different from making tactical allocations between growth and value, depending on a manager’s judgment of their relative attractiveness.) One of the most important style biases concerns the size of companies in an active portfolio relative to its benchmark index.
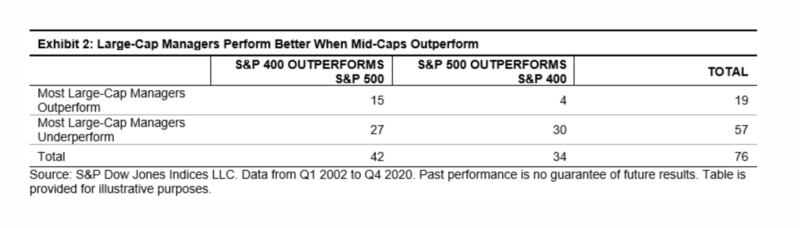
Simple as it seems, style bias has much to say about active management. Exhibit 2 examines quarterly data on the relative performance of the S&P 500 and the S&P MidCap 400. Of 76 quarters between 2002 and 2020, the S&P 400TM outperformed the S&P 500 in 42. In those quarters, a majority of large-cap managers outperformed the S&P 500 15 times for a 36% hit rate. In contrast, in the 34 quarters when the S&P 500 beat the S&P 400, the frequency with which most large-cap managers outperformed fell to 12% (4/34).
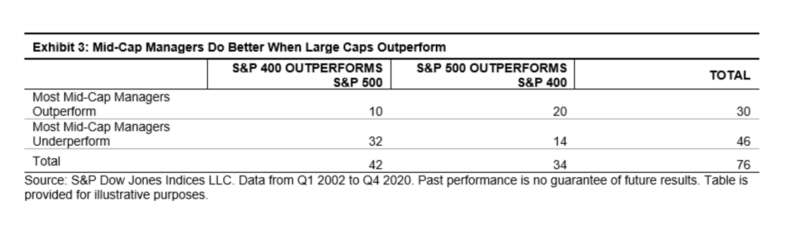
We see an analogous effect among mid-cap managers, as shown in Exhibit 3. When the S&P 400 outperformed the S&P 500, the frequency with which most mid-cap managers outperformed was 24% (10/42). When the S&P 500 dominated, however, the likelihood that a majority of mid-cap managers would outperform was 59% (20/34).
Historically, large-cap managers perform better when mid-cap stocks beat large caps, and mid-cap managers perform better when large caps beat mid-caps. These results suggest that the average large-cap manager has a small-cap tilt relative to his benchmark, while the average mid-cap manager has a larger-cap tilt. These inferences, which are quite reasonable, help explain SPIVA’s 2020 results. Smaller-cap managers could add value by moving up the capitalisation scale. No such reprieve was available to large-cap managers last year.
CRAIG LAZZARA is Managing Director and Global Head of Index Investment Strategy at S&P Dow Jones Indices.
MORE FROM S&PDJI
For more valuable insights from our friends at S&P Dow Jones Indices, you might like to read these other recent articles:
Three reasons for active managers to feel positive
What does GameStop mean for market efficiency?
Is equal weighting worth considering?
Beware spectacular success stories
2020 and the danger of extrapolation
Three reasons why the index advantage will persist
PREVIOUSLY ON TEBI
Money is only one aspect of retirement planning (1/2)
Woodford — a tale of complacency, incompetence and deceit
Should endowments persist with private investments?
Are YOLO traders undermining efficient markets?
Don’t let the stock market distract you
Market efficiency and the case of Pete Rose
WOULD YOU LIKE TO PARTNER WITH US?
TEBI’S work would not be possible without the support of our strategic partners, to whom we are very grateful.
We currently has three partners in the UK:
Bloomsbury Wealth, a London-based financial planning firm;
Sparrows Capital, which manages assets for family offices and institutions and also provides model portfolios to advice firms; and
OpenMoney, which offers access to financial advice and low-cost portfolios to ordinary investors.
We also have a strategic partner in Ireland:
PFP Financial Services, a financial planning firm in Dublin.
We are currently seeking strategic partnerships in North America and Australasia with firms that share our evidence-based and client-focused philosophy. If you’re interested in finding out more, do get in touch.
© The Evidence-Based Investor MMXXI
Robin is a journalist and campaigner for positive change in global investing. He runs Regis Media, a niche provider of content marketing for financial advice firms with an evidence-based investment philosophy. He also works as a consultant to other disruptive firms in the investing sector.