Just 2% of large-cap core funds have beaten the S&P 500 since 1993
- Robin Powell

- Jan 14, 2023
- 2 min read
Updated: Nov 6, 2024

By TIM EDWARDS
30 years ago, Bill Clinton was getting ready for his inauguration as the 42nd U.S. president, the S&P 500 closed a little over 430 and the latest edition of was trumpeting that 1993 would be “The Year of Picking Wisely” in the stock market. Meanwhile, a different kind of security was about to make its revolutionary debut on the New York Stock Exchange; one that would make it possible to trade a whole index-worth of stocks, all at once.
On January 29, 2023, the world’s longest-surviving exchange-traded fund — initially known as the Standard & Poor’s Depository Receipt or by the acronym SPDR (the “Spider”) — will celebrate 30 years since it began trading. Now among the largest funds in the world, and on some days the most heavily traded security anywhere, we mark the anniversary with a one-off special edition of our SPIVA analysis, covering the 29-and-a-bit years since that launch.
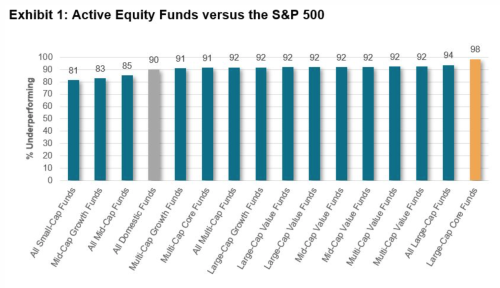
Exhibit 1 compares the performance of actively managed U.S. equity mutual funds over the nearly 30-year period, using the same analytical engines and data sources as our regular SPIVA U.S. Scorecards and based on the nearest quarter ends. Statistics for the U.S. large-cap core category and all domestic U.S. equity active funds are highlighted.

The figures tell a remarkable story. Over the full period, just 2% of actively managed Large-Cap Core funds beat the S&P 500. Even in categories such as small- and mid-sized stocks, and growth — which benefited from the tailwinds of an outperforming universe — a minimum of 81% of actively managed funds underperformed the benchmark. Overall, across all categories, 90% of actively managed funds underperformed the S&P 500.
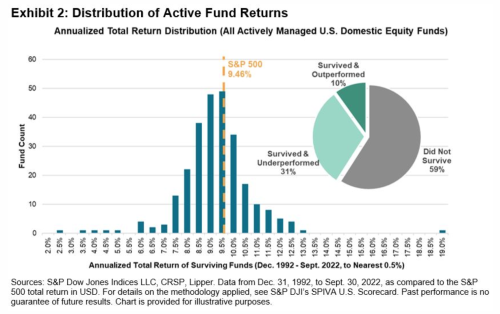
The higher fees typically charged by actively managed funds may be part of the reason that so many funds underperformed, although other factors may have also been at play. Index funds and ETFs charge fees too, but the results of Exhibit 1 would be significantly altered when accounting for them. Even among surviving funds — which we might well suppose generally performed better — 57% of domestic funds underperformed the S&P 500 by more than a percentage point per year. To illustrate the range of returns, Exhibit 2 plots the distribution of annualized returns for all the actively managed domestic equity funds that survived to post a full-period return. It also shows the breakdown of fund survivorship. For reference, the “Spider” had an initial fee of 0.2% annually (it was later reduced to just under 0.1%).

Investing in an index tracker was seen (by some) as an admission of defeat back in early 1993. At best, an index fund was “settling for average”. But, as it turns out, a portfolio approximately replicating the S&P 500’s return would have been emphatically average since then. For the Spider that spun such silk, I hope you’ll join the S&P DJI team in wishing it a very happy 30th birthday.
© The Evidence-Based Investor MMXXIV. All rights reserved. Unauthorised use and/ or duplication of this material without express and written permission is strictly prohibited.


