
Do active funds in downturns really protect you? What 26 years of data reveals
- Robin Powell

- Nov 10, 2025
- 7 min read
Updated: Mar 20

Active fund managers often claim they earn their fees when markets fall. New research on active funds in downturns spanning 26 years suggests there's some truth to this, but the mathematics of investing mean it makes almost no difference to your returns.
When markets plunge, investors crave reassurance. They want to believe someone is steering the ship. A skilled professional who can sidestep the carnage, hold cash at the right moment, or rotate into defensive sectors before the storm hits.
The fund management industry knows this. As decades of evidence have mounted against active management in normal conditions, the "downside protection" argument has become its last refuge. The pitch: yes, we may lag in bull markets, but we earn our fees when it matters. When panic grips the market, you'll be glad to have a human at the helm rather than an index blindly tracking everything downward.
It's a psychologically compelling story. And unlike many industry claims, this one has at least some empirical basis.
But "some basis" and "a good reason to pay higher fees" are very different things. Recent research, including a comprehensive 26-year analysis from Morningstar, suggests the downturn defence is far weaker than its proponents claim.
What 26 years of data shows
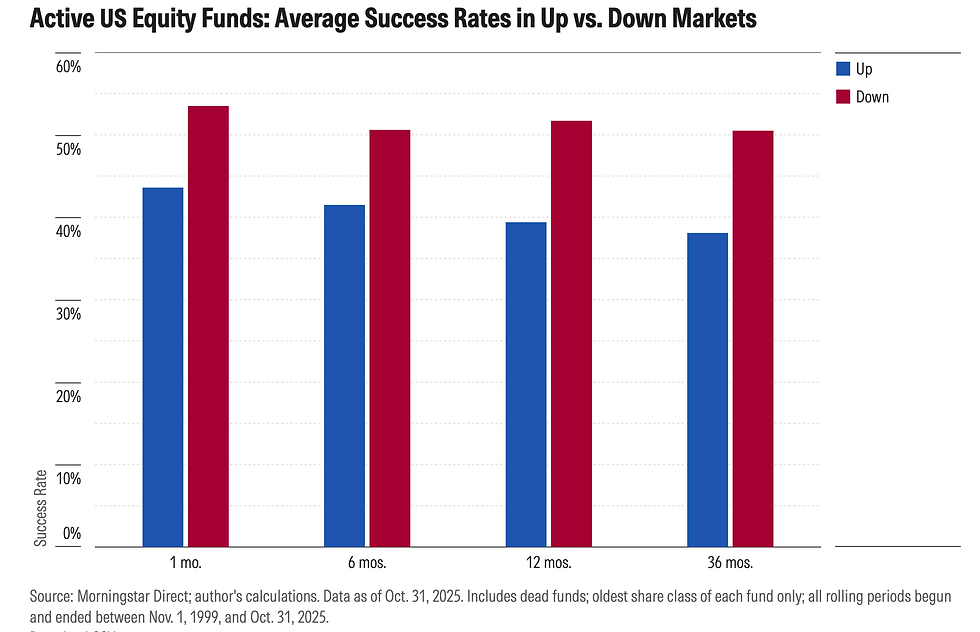
Do active funds in downturns outperform? Jeffrey Ptak, Morningstar's chief ratings officer, set out to answer this with unusual rigour.
He compiled every active US equity fund's rolling one-, six-, 12-, and 36-month returns over the 26-year period ending October 2025. He compared each fund's performance against a style-matched benchmark and counted how often active funds beat their index in rising versus falling markets.
The results offer some vindication for the industry.
Active funds do succeed more often when markets decline. Over rolling 36-month periods, they outperformed their benchmarks 51% of the time when those benchmarks posted losses, compared with just 38% when benchmarks gained. The pattern held across all time horizons, from one month to three years.
The margin of victory matters too. When active funds beat their benchmark during a down period, they did so by an average of around 4% annually. In up markets, the average winner's margin was closer to 3%.
At first glance, this looks compelling. But Ptak's analysis doesn't stop with these flattering figures. The real question isn't whether active funds perform relatively better in downturns. It's whether that advantage translates into better outcomes over time.
And that requires understanding something the industry prefers not to mention: how rarely markets fall.
The mathematical trap
Here's what the downturn defence conveniently omits: markets rise far more often than they fall.
Over Ptak's 26-year sample, more than 80% of rolling three-year periods saw positive benchmark returns. The disparity is stark. Of roughly 800,000 rolling 36-month measurements, around 640,000 occurred during rising markets. Barely 160,000 came during periods when the benchmark lost ground.

This changes everything.
Even with better odds in downturns, active funds spend most of their time in conditions where they underperform. In rising markets, 62% lagged their benchmark. When they lagged, they did so by an average of 3.5% annually. That's a wider margin than the 2.9% by which the average winner outperformed.
The losses in good times swamp the gains in bad.
Ptak calculated the net result across all rolling 36-month periods. In up markets, the average active fund trailed its benchmark by 1.1% annually. In down markets, it beat its benchmark by a modest 0.3%. Combine them, weighted by frequency, and the overall drag is 0.8% per year.
Think of it as insurance that pays out modestly during rare events but charges premiums exceeding the payouts over time.
And remember: even in falling markets, active funds achieved only "about a coin flip's odds" of beating their benchmark, as Ptak put it. 51% beats 38%, certainly. But it's hardly the dependable shelter the marketing implies.
The stress tests: COVID and 2022
Theory is one thing. What happens when the promised protection meets an actual crisis?
The COVID-19 crash of February to March 2020 provided a brutal laboratory. Over five weeks, broad market averages fell by roughly a third. If ever active managers were going to demonstrate their value, this was the moment.
Many didn't.
John Shoven and Daniel Walton analysed US target-date funds and found that 75% of actively managed TDFs failed to match their passive counterparts during the crash. These are precisely the funds where downside protection matters most. They're designed for investors approaching retirement, who can least afford steep losses.
The picture was no better for sustainable equity funds. In a paper published in August this year, Fei Fang and Sitikantha Parida compared active and passive sustainable funds across the pre-crash, crash, and recovery phases. Their verdict was unequivocal: active sustainable funds did not outperform their passive peers "in any period."
The details are damning. During the crash months, active sustainable funds lost between 1.24% and 2.05% monthly. Index funds lost between 0.79% and 1.55%.
The fee gap compounds the damage. In Fang and Parida's sample, active funds charged 0.97% annually versus 0.38% for index funds. When everyone is losing money, that 0.59 percentage point difference bites deeper.
Then came 2022. A different kind of crisis: surging inflation, aggressive rate rises, war in Ukraine.
Morningstar's Active/Passive Barometer assessed performance across 43 equity categories. Just 35% of active funds survived and outperformed their passive peers in the year to June 2022. Only seven categories showed a success rate above 50%.
The researchers noted something striking. This was "the type of environment where active managers could have been expected to beat passive peers more easily." Yet active managers "failed to impress."
Two crises, two years apart, with different causes. The same verdict.
Active funds in downturns: the UK picture
UK investors might wonder whether their home market tells a different story. It does, but not one that favours active management.
SPIVA data for UK equity funds reveals a tale of two crises.
During 2020, active managers enjoyed a genuinely unusual year. Around four in five UK active equity funds beat their benchmark. UK small-cap funds were particularly strong, with roughly 85% outperforming. The downturn defence, for once, appeared vindicated.
Then came 2022.
In the first half, 96% of UK large and mid-cap funds underperformed. Over the 12 months to mid-2022, the figure rose to 98%. For the calendar year, just 7.8% of active UK equity funds beat their benchmark.
Same managers. Same supposed skill. Radically different outcomes.
The uncomfortable truth: "active shines in a crisis" is not a reliable rule. It depends entirely on which crisis. COVID rewarded certain positioning; the inflation shock of 2022 punished it. Investors can't know in advance which type of downturn will arrive.
The long-term reality remains stubbornly consistent. Over ten years, 81% of UK equity funds underperform their benchmark. Even UK small caps, the apparent bright spot, fail to show majority outperformance across a decade.
One strong year is a blip in a longer pattern where index funds come out ahead.
The one exception, and why it doesn't help
Amid this weight of evidence, one study offers a glimmer of hope for active management's defenders.
Huangyu Chen and Dirk Hackbarth examined 40 actively managed sector funds from Fidelity between 1998 and 2016. An equal-weighted portfolio of all these funds, rebalanced monthly, delivered benchmark-adjusted returns of around 5.7% annually. This was described as "resilient to market downturns and tail risk."
Finally, evidence that active managers can protect investors when it counts?
Not quite. The details matter.
First, the outperformance came not from picking winners but from diversifying across all 40 funds. Individual sector funds showed "weak evidence of selection skill." Skill, if present, was collective rather than individual.
Second, against the fair benchmark (passive sector ETFs rather than the broad market) outperformance shrank from 5.7% to around 3.7% annually. Against a richer factor model, it roughly halved again and may not have been statistically significant.
Third, the data ended in June 2016, predating both COVID and 2022. Whether the resilience would have held through either crisis remains unknown.
To capture this "active" advantage, an investor would need to buy all 40 sector funds and rebalance monthly. A strategy so diversified it becomes a high-cost quasi-index. The benefit of active management required eliminating most of what makes it active.
That's an admission: the edge, if it exists, can't be reliably captured through fund selection.
What this means for investors
So where does this leave us?
Yes, active funds in downturns do perform relatively better than in rising markets. But this modest advantage is swamped by two realities: markets rise far more often than they fall, and even in falling markets, active funds achieve only coin-flip odds of success.
When actual crises arrive, the promised protection frequently fails to materialise. COVID and 2022 both offered ideal conditions for skilled managers to prove their worth. Most didn't.
The fee mechanism works against investors precisely when they need help most. In compressed-return environments, higher charges become proportionally more damaging. A 0.6 percentage point fee gap hurts far more when everyone is losing 20% than when everyone is gaining 15%.
Past performance offers little guidance. Shoven and Walton found that a 1% annual advantage in one five-year period predicted only nine basis points of advantage in the next. The managers who navigated one crisis well may flounder in the next.
Markets will fall again. When they do, active managers will once again claim vindication, pointing to strong relative performance and insisting the tide has turned.
Investors should greet such claims with scepticism. The mathematics haven't changed. The long-term odds haven't shifted.
The best protection in a downturn remains what it has always been: a diversified portfolio, low costs, and the discipline to stay the course.
Recently on TEBI
Stop paying premium fees for advice that ignores what actually works
Use our Find an adviser service to connect with professionals who've committed to low-cost indexing, transparent pricing, and putting your interests first. See who's available near you today.


