
Why stock picking is even harder than you think


New research covering 50 years of UK stock market data reveals why stock picking is a far harder game than most investors realise — and why the odds have been getting worse for decades.
On 27 October 1986, the City of London changed overnight. Big Bang — the sweeping deregulation of financial markets — tore up the old rules, opened the doors to foreign competition, and promised a new era of opportunity for investors. What nobody knew at the time was that it also marked the moment stock picking in Britain went from difficult to nearly impossible.
Before Big Bang, the UK market was a surprisingly forgiving place. Researchers at the University of Strathclyde have now shown that in the pre-deregulation era, the majority of individual stocks delivered a higher return than a savings account. The haystack, as Jack Bogle might have put it, was full of needles. You didn't need to be brilliant to find one.
After 1986, the needles started disappearing. The market that emerged from deregulation — globalised, technology-driven, dominated by a shrinking number of giant winners — turned the odds against stock pickers in ways that most investors still don't appreciate. They assume the difficulty is about information, or skill, or time. It isn't. It's structural.
Jonathan Fletcher and Michael O'Connell of the University of Strathclyde spent years examining every stock listed on the UK market between January 1975 and December 2024.
Their findings, published in the Journal of Asset Management, amount to the most comprehensive verdict yet on whether ordinary investors can hope to beat the market by picking their own shares.
50 years of data, one devastating finding
Just 3.1 per cent of UK stocks generated all the real wealth created by the British stock market between 1975 and 2024. The remaining 97 per cent collectively destroyed value in real terms.
Using a methodology developed by Hendrik Bessembinder at Arizona State University, the Strathclyde researchers measured each company's net contribution to real wealth — returns above inflation and above what investors could have earned in Treasury bills (short-term government bonds, the standard benchmark for a "risk-free" return). Fewer than half of all UK stocks — 46.5 per cent — created any positive real wealth over their lifetimes. In any given year, an individual stock had roughly a coin-flip chance of beating a T-bill, and less than a 45 per cent chance of beating the market index.
The names that carried the entire market tell a familiar story. Shell created £15.9 billion in net real wealth. BP added £12.8 billion, HSBC £11.3 billion, British American Tobacco £11.2 billion, AstraZeneca £10.9 billion. Those five companies — out of the thousands that listed in London across five decades — accounted for roughly a fifth of the market's entire £305 billion in real wealth creation.
This isn't a UK peculiarity. Bessembinder's updated US data tells the same story at a larger scale: roughly 4 per cent of American stocks generated all $55 trillion of net shareholder wealth through 2022, and the concentration has increased further since. The pattern is global. It's persistent. And it's getting worse.
The game that changed its rules
Before Big Bang, choosing individual shares in Britain was a different game. In the pre-deregulation period — January 1975 to October 1986 — Fletcher and O'Connell found that 28 per cent of companies were needed to account for all net real wealth. Most individual stocks beat Treasury bills. An investor buying a diversified basket of UK shares had a decent shot at doing well.
Then the rules changed. Deregulation opened the City to global competition, cross-border capital flows accelerated, and the market began rewarding scale in ways it hadn't before. The companies that could dominate international markets — HSBC, Shell, AstraZeneca, BAT, Rio Tinto, BP, SABMiller, BHP Billiton, Diageo, Unilever — pulled away from the pack. Those ten names accounted for 38.9 per cent of £206.3 billion in post-Big Bang real wealth.
And the concentration hasn't stabilised. It's accelerating. Since the Brexit vote in June 2016, just 2.5 per cent of stocks generated all the market's net real wealth. Since the onset of Covid in March 2020, the figure dropped to 1.8 per cent. Fewer than two in every hundred UK stocks created any real wealth at all. The chart below shows the trend.

The haystack keeps getting bigger. The needles keep getting rarer. Whatever mix of globalisation, technology, and winner-takes-most dynamics is behind this — and the Strathclyde researchers are careful to attribute it to increasingly skewed returns rather than any single cause — the practical consequence is the same. The stock picker's odds were poor after 1986. They're worse now. And they get worse every decade.
Even the professionals can't escape the arithmetic
If 97 per cent of stocks destroy value, it follows that the people paid to pick stocks will struggle too.
They do. Three independent data sources confirm it.
The SPIVA Europe Scorecard for year-end 2025 found that 88 per cent of UK equity funds underperformed their benchmark (the relevant market index) over one year. Over five years, 92 per cent fell short. Over ten, 93 per cent. Among UK small-cap funds — the space where active managers claim the biggest informational edge — 97 per cent trailed the index in a single year. And those figures only count the survivors. Fewer than half of UK equity funds from ten years ago were still alive at the end of 2025. Among UK large- and mid-cap funds, barely 41 per cent survived the decade. The rest were quietly merged or liquidated, their poor records buried with them.
But here's what's surprising. The problem isn't that managers choose the wrong stocks. Often, they choose the right ones — and still lose.
Morningstar research by Jack Shannon examined 25 years of high-conviction bets in mutual fund portfolios. Between 60 and 66 per cent of these big positions outperformed. But only a third of the funds making those bets beat their benchmarks. The reason is mechanical. A fund manager who holds 5 per cent of a portfolio in a stock that represents 12 per cent of the index is effectively betting against that stock. Regulatory diversification rules, internal risk limits, and the discomfort of concentrated positions prevent managers from weighting their best ideas heavily enough. The index faces none of these constraints — its winners compound at the weight the market assigns, no committee approval required.
Jeffrey Ptak at Morningstar tested this from the other direction. He froze the holdings of the 100 largest active US stock funds at the start of a decade. Those initial selections — before any buying, selling, or fiddling — would have returned 15.2 per cent a year. The index returned 14.9 per cent. The managers' instincts were sound. But the actual funds, after ten years of trading and fees, returned 13.8 per cent. As the chart below shows, doing nothing would have beaten doing something by a comfortable margin.
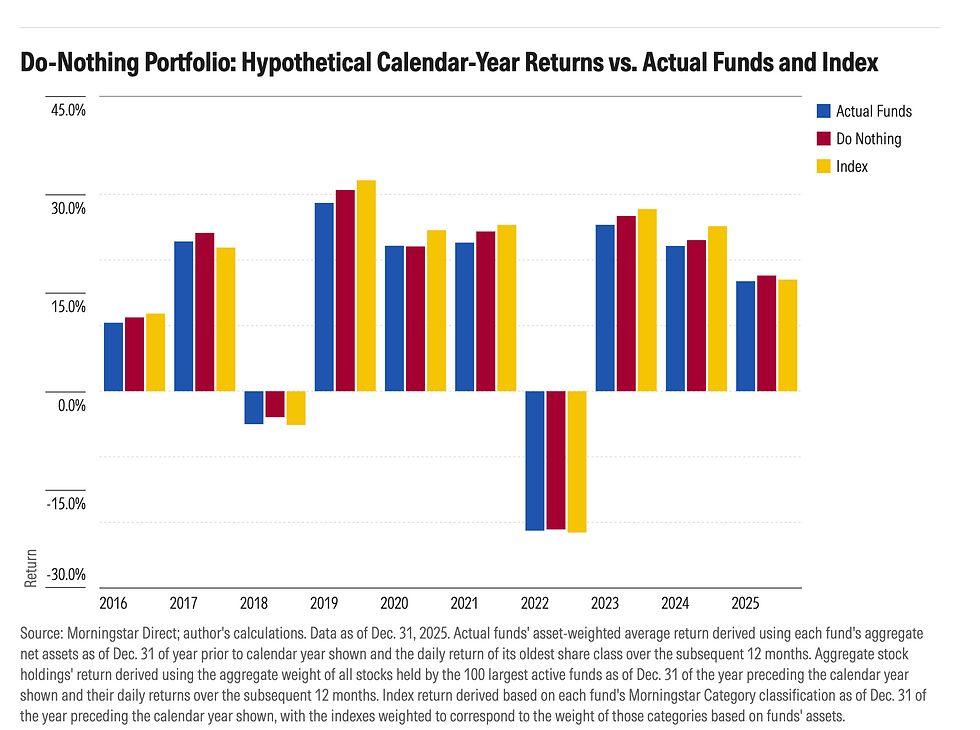
Selection skill alone isn't enough. You also need to size your winners correctly, resist the urge to trade, and overcome the institutional constraints that cap how concentrated your portfolio can be. Almost nobody manages all four.
Yesterday's winners, tomorrow's also-rans
Even if you could spot the rare outperforming fund manager, it wouldn't help you for long. The S&P Europe Persistence Scorecard tracks what happens to top UK equity funds over consecutive periods.
Of those that ranked in the top quartile (the best-performing 25 per cent) over three years, just 2.67 per cent stayed there for the next three. That's not a typo. Fewer than three in a hundred "winners" won again. Over consecutive five-year periods, the figure rose only to 5.80 per cent.
Many never got the chance to try. Sixteen per cent of three-year top-quartile funds were merged or liquidated before the next period ended. Over five-year cycles, more than 20 per cent disappeared.
Past performance isn't a poor guide to the future. In UK equity funds, it's barely a guide at all.
AIM: what concentrated failure looks like
For a vivid picture of what a market full of losing stocks looks like, consider the UK's Alternative Investment Market. The London Stock Exchange promotes AIM as "Europe's most successful growth market." The Strathclyde data tells a different story: AIM stocks' aggregate net real wealth creation was negative £2.6 billion. Not low. Not disappointing. Negative. Only 23.4 per cent of AIM stocks managed to outperform Treasury bills.
AIM has produced individual successes — Jet2, Domino's Pizza, and others that graduated to the main market. But the aggregate picture overwhelms the exceptions. AIM peaked at 1,694 companies in 2007. By February 2025, according to UHY Hacker Young, 679 remained. Seventy-one had delisted in the previous 12 months, 21 of them because of financial stress or insolvency. The LSE says AIM has supported more than 4,000 companies since 1995. Against the 679 still standing, roughly 83 per cent have exited — through takeovers, failures, voluntary delistings, or quiet disappearances.
AIM is the broader market phenomenon stripped of its camouflage. On the main market, the handful of giant winners generate enough wealth to mask the majority's losses. On AIM, there aren't enough winners to do even that.
Why stock picking loses to the index by design
An index fund doesn't win by being clever. It wins because its construction solves the three problems that defeat stock pickers.
First, selection. The Strathclyde data shows that missing even a few of the 3.1 per cent of wealth creators is catastrophic over time. The index owns every listed company — Shell, HSBC, AstraZeneca, and every other wealth creator at full weight. No research required. No conviction needed.
Second, sizing. Fund managers who correctly identify winners often underweight them. The index doesn't. When AstraZeneca's share price doubles, its index weight doubles automatically. No compliance officer intervenes. No risk committee trims the position. The winners compound without interference.
Third, trading. Research by Drienko and colleagues in the Financial Analysts Journal found that active managers show genuine skill in buying stocks — but their selling decisions lag even a random-selling strategy. Roughly 85 per cent of a manager's selection advantage accrues within the first six months; beyond two years, relative performance typically reverses. The index sidesteps the problem entirely. It doesn't sell winners. It doesn't rotate into the next idea. It holds.
Bogle's advice was to stop looking for the needle and buy the whole haystack. The Strathclyde data shows why that instinct was even more right than Bogle knew. In a market where fewer than two in a hundred stocks create all the real wealth, owning the haystack isn't convenient. It's the only strategy that guarantees you own every needle.
Big Bang promised to democratise the City. Four decades on, the evidence says it opened the door to a game almost nobody can win — and a game that gets harder with each passing decade. Post-Brexit, 2.5 per cent of stocks carried the market. Post-Covid, 1.8 per cent.
Stock picking was always hard. What 50 years of data now shows is that it's become something closer to impossible — not because investors lack talent, but because the market's architecture concentrates rewards so narrowly that skill in picking, sizing, and holding must all be near-perfect simultaneously. Even professionals who clear the first hurdle stumble on the second and third.
But none of that matters if you own the whole market. Your index fund holds every stock that will generate tomorrow's wealth, at the right weight, with no temptation to sell too early.
The needles keep getting rarer. You already own the entire haystack.
Resources
Fletcher, J. & O'Connell, M. (2026). Exploring the real wealth creation in U.K. stocks. Journal of Asset Management.
Bessembinder, H. (2018). Do stocks outperform Treasury bills? Journal of Financial Economics, 129(3), 440–457.
Bessembinder, H. (2023). Shareholder wealth enhancement, 1926 to 2022. Working paper, SSRN.
S&P Dow Jones Indices. (2026). SPIVA Europe Scorecard Year-End 2025.
S&P Dow Jones Indices. (2025). Europe Persistence Scorecard Year-End 2024.
Drienko, J. et al. (2025). Excess return profiles for stocks purchased by active equity managers. Financial Analysts Journal, 81(3), 150–175.
Most advisers will never tell you this. A few will.
The ones in our Find an adviser directory have publicly committed to evidence-based principles — low-cost funds, transparent fees, no incentive to churn your portfolio. They've put that commitment in writing. See who's near you.


