They look at the original value metric, the book-to-market ratio, used by Fama and French (i.e. the inverse of the Price/Book-ratio commonly used by practitioners). They claim that since the 1970s accounting rules and corporate finance practices have changed significantly. Most notably, companies now have an increasing amount of capitalised goodwill and other intangibles on their books.
These intangibles increase book value but are not a form of productive capital in the sense that they produce cash flows that are converted into dividends, share buybacks and other revenues for shareholders.
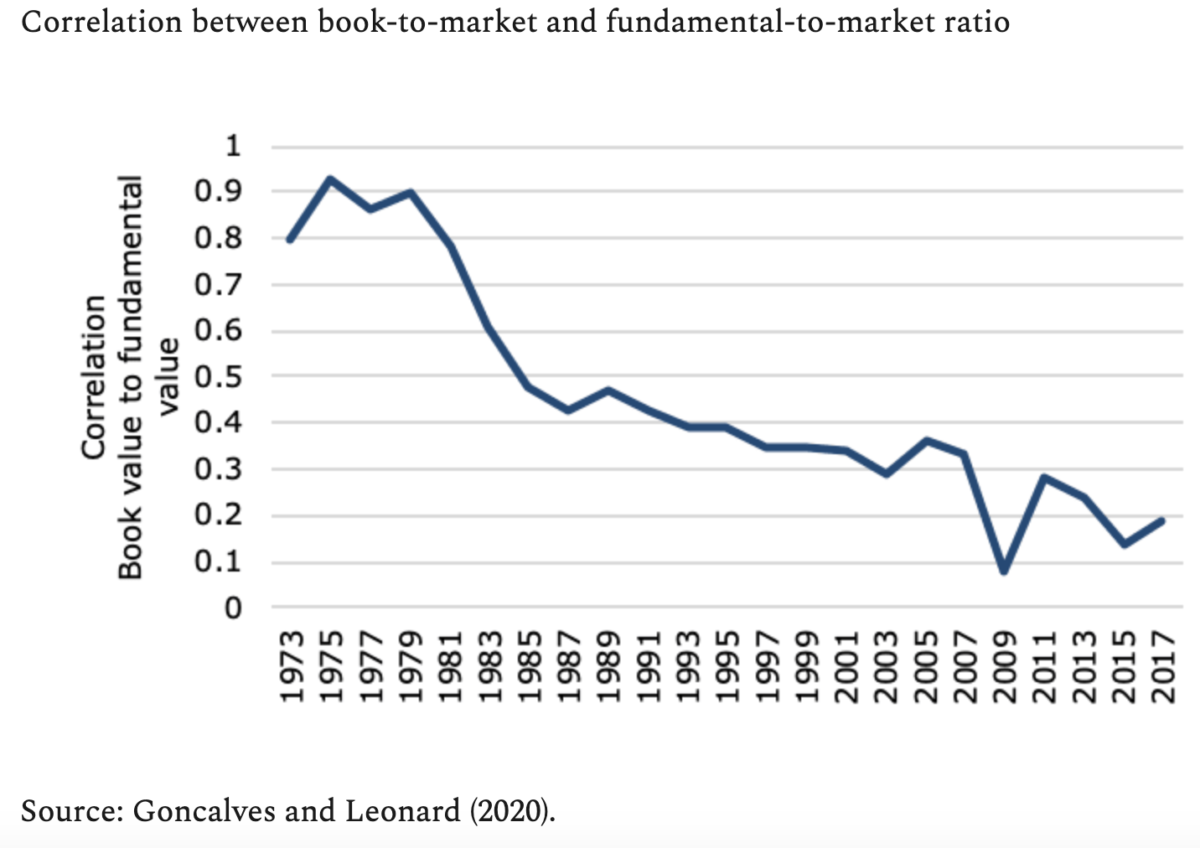
They then calculate a fundamental value that excludes such unproductive forms of capital. The resulting fundamental-to-market ratio is very similar to the book-to-market ratio in the 1970s but starts to diverge more and more in the 1980s and afterward.
The correlation of changes in book-to-market ratio with changes in fundamental-to-market ratio was about 0.8 in the 1970s but has since declined to 0.19 in the most recent two-year period.
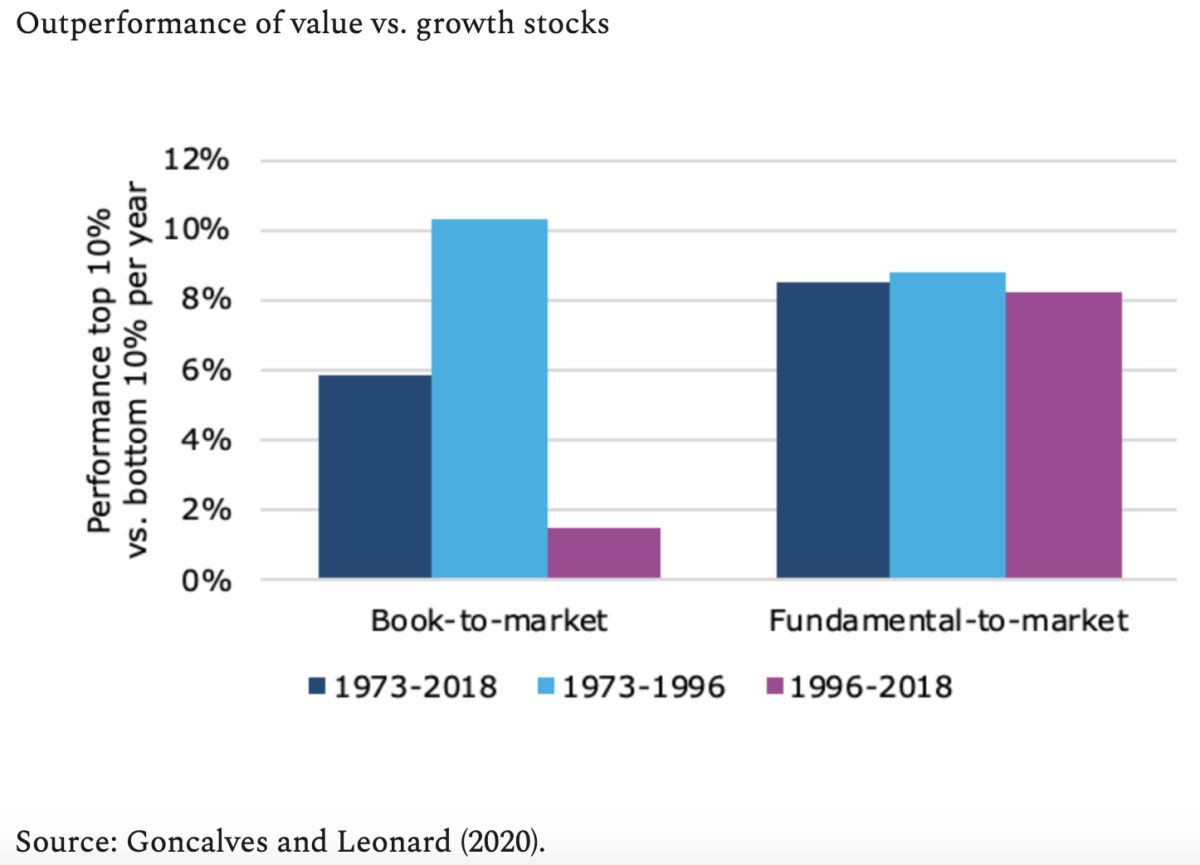
When one then sorts stocks not on book-to-market ratio but instead on this fundamental-to-market ratio, the value premium does not disappear but remains constant over time. Ét voilà, value investing is alive and kicking again.
JOACHIM KLEMENT is a London-based investment strategist. This article was first published on his blog, Klement on Investing.
Joachim is a regular contributor to TEBI. Here are some of his most recent articles:
In their latest research paper, Fama and French examine whether the recent lower returns to the value premium mean that its expected return has changed and conclude that it is within the range of what might be expected by chance.
A further study by Arnott et al. also investigates the issue and, similar to our previous analysis on this, conclude that the higher return of growth stocks is mainly due to their increased valuation level.
At the end of the decade, growth stocks traded at a substantial premium to value, likely creating a tailwind for the future relative returns of value stocks.
A previous note of ours looked at the question “Where has the Value premium gone” (here). There have been many similar research notes circulating on this topic. Two interesting recent contributions come from Fama and French, who studied the value effect in their landmark paper in 19921, and Arnott et al. 2019, some of whom work at Research Affiliates.In the latest paper by Fama and French, “The Value Premium”2, the authors examine the question whether the expected value premium (which they define here as the difference between value portfolio returns and a market-weighted portfolio) declines or even disappears entirely after the period they originally studied between 1963 to 1991 (their “in-sample” period). For example, during this period, value stocks across the US market (large and small) returned 0.42% per month with a t-statistic of 3.31 i.e. a highly statistically significant result. This (amongst other such studies) is a key reason why researchers and practitioners consider value to be an important return factor in equity markets. Since then however, returns to value stocks have been lower. In the period 1991 to 2019 the market-wide value premium was just 0.11% per month (t-stat 0.60), much lower than in the first period. Over the full period up to 2019, the corresponding return premium was 0.26% (t-stat 2.37)) – still a statistically significant result. The issue is whether we can say that the premium is meaningfully lower in the period since 1991 (their “out-of-sample” period) and that the expected premium is also lower.
Fama and French note that the spread in book-to-market (B/M), i.e. the difference in the respective B/M ratios of value and growth portfolios, has declined over the two periods. They also show a statistically significant relationship between the prior B/M spread and the value premium each month over the full period. Since on average the spread has declined in the post-1991 period, that explains some of the decline in the value premium. However, they caution that in their analysis, the remaining volatility of the value premium is high after controlling for the B/M spread. Hence, they state “the high volatility of monthly value premiums clouds inferences about whether the declines in average premiums reflect changes in expected premiums.” Moreover, they state that there is insufficient statistical evidence to argue that the expected value premium in the latter period is any different from what it was in the first “in-sample” period. So, from this analysis, there is no reliable evidence to argue that the expected return of the value factor may be lower going forward – although it does not exclude the possibility that it might be. As French whimsically comments here: “There are a lot of questions one would like to know the answer to, but you just can’t tell…If I get to ask God a question, I’m probably not going to ask this one.”
The second paper mentioned above takes a different perspective on the issue and provides a stronger case for why we might argue that the value premium is likely to reassert itself in the future. Among the authors are Robert Arnott and Campbell Harvey. By way of background, Robert Arnott is a distinguished quantitative practitioner and founder of Research Affiliates where he and his colleagues developed the value-oriented Fundamental IndexTM strategy. Campbell Harvey is a highly regarded academic at Duke University who has also recently written a well-known critique on the academic proliferation of factors and recommends setting the bar much higher before recognising a factor as having statistical validity.
In their paper “Reports of Value’s Death May Be Greatly Exaggerated”3, the authors examine various reasons for why the value premium has been negative in the period after the Global Financial Crisis (GFC), which they take as mid-2007, compared to the period before (from 1963). Among other issues, they investigate whether there is evidence that a/ investors have crowded into value stocks, potentially diminishing the premium going forward; b/ there is less migration from value to growth (an important source of the value premium historically); c/ there has been a change is the profitability of either value or growth stocks to the detriment of value and/or benefit of growth stocks. In a careful analysis, the authors decompose the difference in returns between value and growth stocks into three components:
Revaluation – the change in the relative price-to-book (P/B, which is just the inverse of B/M) valuation between value and growth. As our own analysis shows, and is confirmed in this paper, there is a very strong relation between the change in the relative valuation of value and growth stocks and the return of the value factor.
Profitability – the difference in profitability between value and growth stocks. Growth stocks are generally more profitable than value stocks and can sustain that advantage for many years after portfolio formation. A change in relative profitability could undermine the value premium.
Migration – the way that value (or growth) stocks in one period migrate to being neutral or growth (or value) stocks subsequently. As Fama and French showed in their paper on this4, migration is a substantial source of the value premium: as the prospects of some value stocks improve, their prices go up and so do their P/B ratios and so they move up to neutral or growth; similarly, some growth stocks fall to lower price levels, thus migrating to either neutral or value.
The migration and profitability components are central to the value premium. On average, the returns associated with migration exceed those of the returns linked to profitability differences. However, the effect of the revaluation of value and growth portfolios will buffet their relative returns from period to period and is a considerable source of risk – as is currently in evidence – since it can trend in one direction for extended periods (see the dotted line in the last chart below). Revaluation cannot persist for ever otherwise there would be an excessive bubble in growth stocks that would eventually revert.
Subtracting the revaluation component gives what the authors call the “structural” component of the value premium which comprises the profitability and migration components. In their analysis, they show that both components are similar in the post- 2007 period compared to their respective levels in the period before the GFC. As before, the migration component is stronger than the profitability component. In fact, the revaluation effect explains more than 100% of the difference in returns between value and growth stocks since 2007 mainly because growth stocks have become more expensive. This is clearly not an outcome driven by investors crowding into value stocks – quite the opposite and, if anything, seems to reflect herding into stocks with high growth opportunities. This is not to say that growth stocks will not deliver higher profits compared to value stocks in the future, they almost surely will. However, they are priced at a level that reflects that and more. History shows that they eventually revert from these elevated levels.
They note that a reversal of the value spread would provide a benefit to the value premium just as its recent widening has detracted from it. However, they also stress that, even if the valuation spread stayed the same, value stocks have an in-built advantage since the “structural” component of the value premium is robustly positive. Of course, the last time the value spread was this elevated, it peaked at a higher level still.
Another topic that Arnott et al. examine in their paper is whether price-to-book is still meaningful as a metric of value, especially as we have moved into an information and technology driven economy. They suggest that it makes sense to incorporate intangibles when considering the fundamentals of companies. At the least they support the use of other metrics other than just book-to-market when evaluating whether companies are value or growth. We will revisit this issue in a subsequent post.
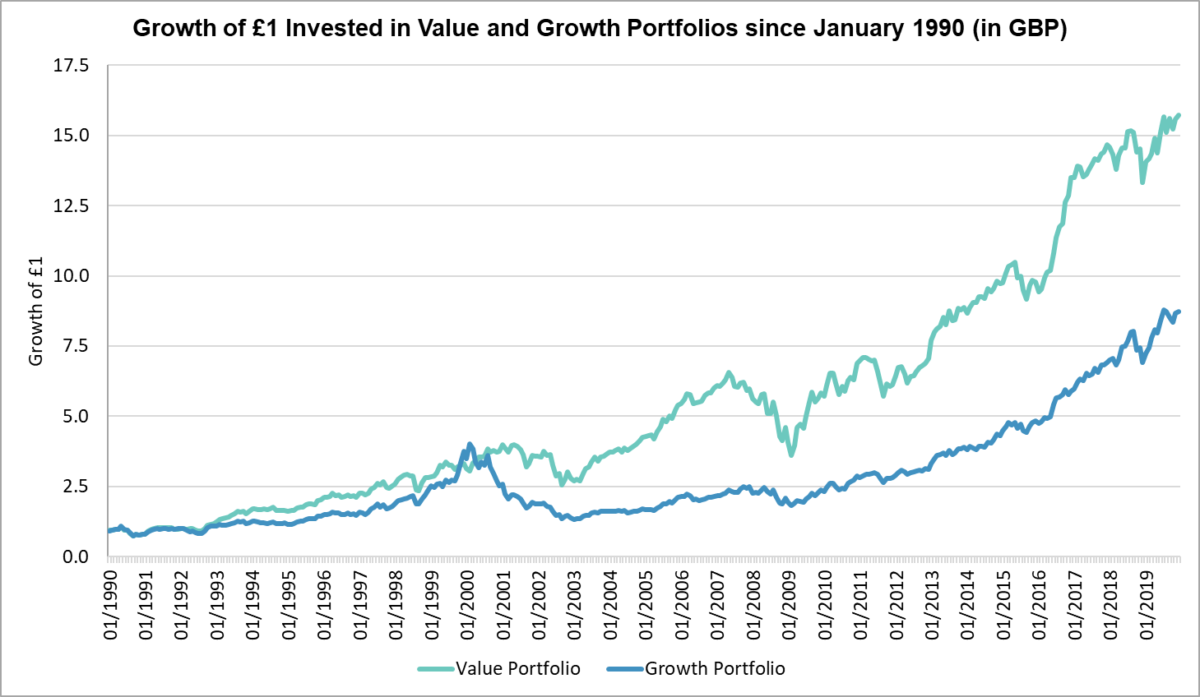
Below we update the charts we showed before that show the relative returns of value and growth stocks globally. The details of portfolio construction are in the notes at the end5. A chart of the returns is shown in the figure below as the growth of £1 invested in each portfolio. Note that the period covered in our charts below only covers the later of the two periods that Fama French consider, as we do not have data for global developed markets going back to the 1960s.
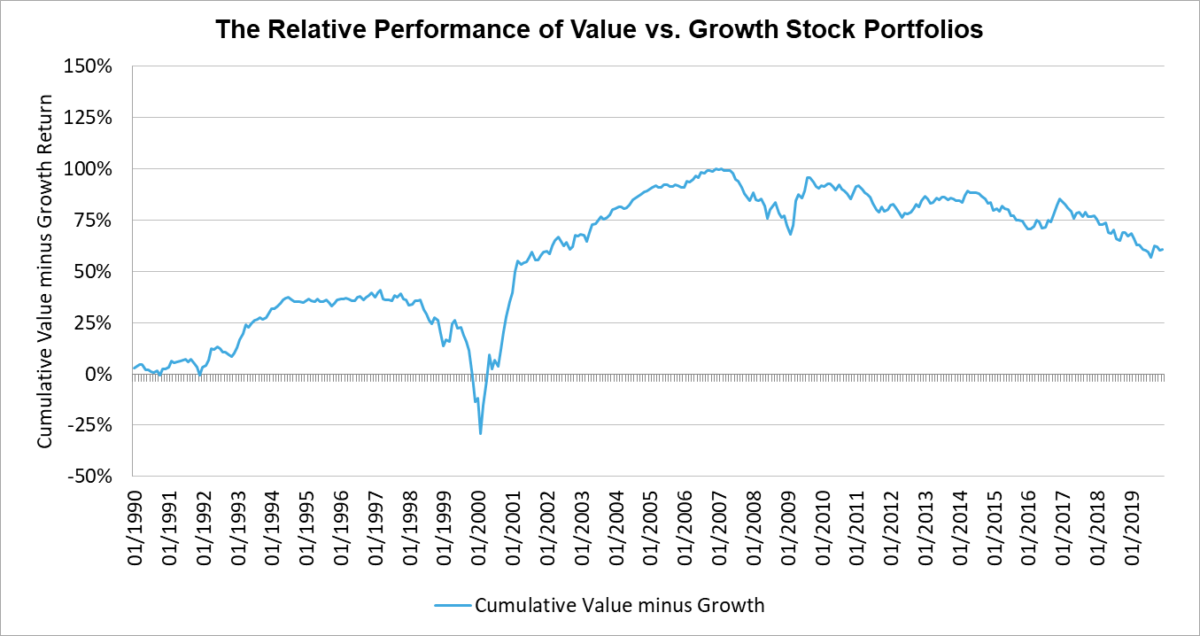
To track the relative returns of value vs. growth, each month we subtract the return of the global growth portfolio from the global value portfolio, and we cumulate that sum through time as shown in the chart below.
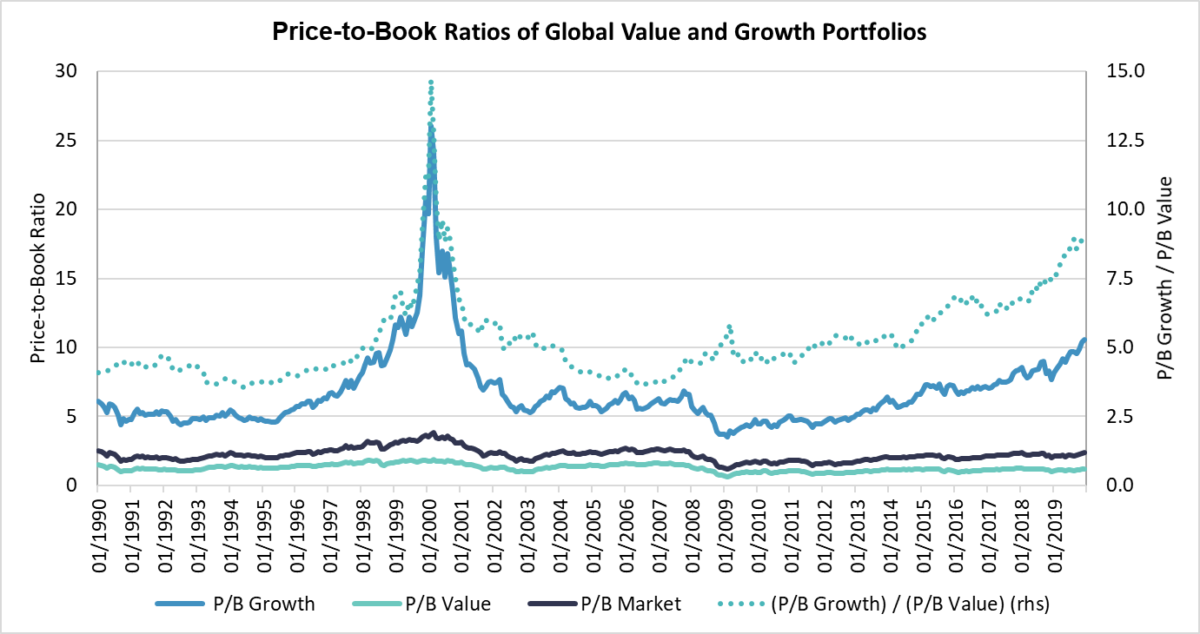
The third chart below shows the P/B ratio of the growth and value portfolios constructed as above as well as that of the overall market, all as solid lines using the left-hand scale. Note that, as Arnott et al. also show, the relative P/B level of growth vs. value has been climbing since 2007. At the end of 2019, using our portfolio construction procedure, growth stocks traded at a P/B level of 10.59 vs 1.19 for value, and therefore the ratio of their respective P/B levels was 8.92 – a level last reached in 2000.
Even a relatively limited reversal of the valuation spread between value and growth stocks should provide a benefit to the future relative returns of value stocks. However, there’s no telling when such a reversal could occur, or how much wider the spread could get in the meantime.
Sources:
1 Fama, Eugene F., and Kenneth R. French, 1992. The Cross-Section of Expected Stock Returns. Journal of Finance, vol. 47, no. 2, p427-465.
4 Fama, Eugene F., and Kenneth R. French 2007. Migration. Financial Analysts Journal, Vol. 63, No. 3, p48-58.
5 For our returns and characteristics data, we use a well-known source of independent data provided by Style Analytics. Using their analysis tools, we create portfolios based on book-to-market (B/M), which is a standard metric for sorting stocks on value-versus-growth, and then track the returns and characteristics of these simulated portfolios through time. For our purposes here, we create global portfolios where we capture the top 30% (value) and the bottom 30% (growth) by market value of stocks when ranked by B/M. We set the country weights in each portfolio to match their market weights in a broad index. We also exclude the bottom 5% of each market to avoid any potential distortions due to micro-cap stocks. All returns are in UK sterling. We start the portfolios at the end of 1989 (if we go further back than this, the data coverage declines).
If you are a UK-based financial adviser or planner, and you would like to hear Garrett Quigley speak, why not register for The Values-Based Adviser in Birmingham on Thursday 23rd April?
The event will be compered by TEBI founder Robin Powell.
There’s an excellent line-up of speakers, and we’re going to be looking at:
— the growing interest from clients in sustainability issues;
— the difference sustainable investing can make to the world around us;
— how to engage with clients and prospects about their personal values; and
— how to invest clients’ money sustainably in an evidence-based way.
It costs £25 per adviser. If you or any of your colleagues would like to come, here’s the link to register:
Comments Off on What can academia teach investors?
Some financial professionals are dismissive of academic research, arguing that it’s too far removed from the realities of today’s financial markets. True, academic models are, by their nature, theoretical. But that doesn’t mean investors can’t learn practical lessons from them.
In this video, Gerard O’Reilly from Dimensional Fund Advisors briefly explains what those lessons are.
This video was produced for Ifamax Wealth Management, an evidence-based advice firm serving clients in Bristol and south-west England.
If you would like us to put you in touch with an evidence-based firm in your area, get in touch and we will try to help you.
If you are a financial adviser and would like to subscribe to regular videos such as these to provide your clients with the information and support they need, our colleagues at Regis Media will be happy to help you.
Video transcript:
When we talk about evidence-based investing, what we’re really referring to is academic evidence. Some financial professionals are dismissive of academic research, arguing that it’s too far removed from the realities of today’s financial markets.
True, academic models are, by their nature, theoretical. But that doesn’t mean investors can’t learn practical lessons from them. Here’s Gerard O’Reilly from Dimensional Fund Advisors.
“Academics come with models of the world, and those models are usually incomplete. But what do you learn from the models? You gain insight about the real world. The models have to be incomplete for you to learn from them, but you do learn. You can gain insights about better ways to invest, better ways to structure portfolios, so that when you come to the real world, you’re better equipped and have better frameworks to make rational investment decisions.
“So academia, by its nature, has to simplify the real world so that you can understand the real world better. But that’s the beauty of how academics approach the problem: they simplify it just enough so that it’s real enough to be interesting, but understandable enough so that you learn something.”
Dimensional is possibly unique among asset managers in that everything it does is based on empirical evidence. Over the years, the firm has worked with some of the most famous names in academic finance.
“Gene Fama, who won a Nobel prize a few years ago, is an academic that we have been very closely related to since the founding of the firm. Along with Kent French who’s a co-author and a very close collaborator with Gene Fama. And what we’ve used from their work, and they have shared their work with us and the world over time, is really the intuition that their work has given to us about prices – securely prices reflecting information.
“Other academics are academics like Robert Merton, who also won a Nobel Prize, Myron Scholes has also won a Nobel prize – and their work has also given us tremendous insights, whether it’s in lifecycle finance or in how to structure portfolios. So they’re to name just a few of what I would call some of the great academics in finance, and there’s many more that we’re associated with and that we work with. But the work that they have done has really led to some big innovations in the field of practical investing that I think Dimensional has been able to use to the benefit of our clients.”
The most famous contribution that Fama and French have made to our understanding of the financial markets is the so-called Three-Factor Model, and an updated version, the Five-Factor Model. In a nutshell, Fama and French have demonstrated how certain types of stocks — for example, value stocks, small-company stocks and stocks of firms with high profitability – tend to outperform the market as a whole, over the long term.
“We think that there are differences in expected returns across stocks and across bonds. How do you identify those? With the intuition from the Three and Five-Factor Model. Lower price, higher-expected cash flows, higher-expected returns. So, we say, how do we structure portfolios? Let’s look for low-price stocks relative to some fundamental measure of firm size, high-expected cash flow i.e. high profitability. That’s higher-expected returns, less overweighting those stocks.”
It’s not necessary for investors to have a detailed understanding of the work of Fama and French, but it pays to use an adviser who does have that level knowledge. Academic research really does provide us with insights that you, as an investor, can benefit from.
Comments Off on The outsize rewards for owning the top-performing stocks
This is a guest post from DIMENSIONAL FUND ADVISORS
The stocks commonly referred to by the FAANG moniker — Facebook, Amazon, Apple, Netflix, and Google (now trading as Alphabet) — have posted impressive gains through the years, with all now worth many times their initial-public-offering prices. The notion of FAANG stocks as a powerful group of top-performing stocks, holding sway over the markets has sunk its teeth into some investors. But how much of the market’s recent returns are attributable to FAANG stocks? And does their performance point to a change in the markets?
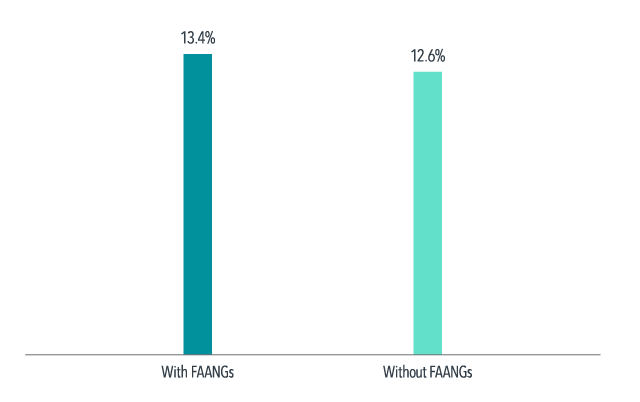
Over the 10 years through December 31, 2018, the US broad market [1] returned an annualised 13.4%, as shown in Exhibit 1. Excluding FAANG stocks, the market returned 12.6%. The 0.8-percentage-point bump resulted from the FAANGs collectively averaging a 30.4% yearly return over the decade.
Exhibit 1: A little help from the FAANGs
Annualised US market compound returns with and without Facebook, Amazon, Apple, Netflix, and Alphabet (Google), 2009-2018
Investors may be surprised to learn that it is actually common for a subset of stocks to drive a sizeable portion of the overall market return. Exhibit 2 shows that excluding the top 10% of performers each year from 1994 [2] to 2018 [3] would have reduced global market performance from 7.2% to 2.9%. Further excluding the best 25% of performers would have turned a positive return into a relatively large negative return.
Exhibit 2: Weighing the impact
Global stock market performance excluding top performers, 1994-2018
This lesson also applies to capturing the premiums associated with a company’s size and its price-to-book ratio. Research by Eugene Fama and Kenneth French (Migration, 2006) provides evidence that these premiums are driven in large part by a subset of stocks migrating across the market.
Research has shown no reliable way to predict the top-performing stocks. Looking at the top 10% of stocks by performance each year since 1994, on average less than a fifth of that group has ranked in the top 10% the following year.
The tendency for strong market performance to be concentrated in a subset of stocks is therefore also a cautionary tale about the importance of diversification — investors with concentrated portfolios may actually miss out on the very stocks that deliver the best of what the market has to offer. An investment approach built around broad diversification can help achieve a more reliable outcome for investors over the long term — sharp acronym or not.
Footnotes
[1] With-FAANGs portfolio formed each month including common stocks listed on NYSE, NYSE MKT and NASDAQ. Stocks are weighted by market capitalisation. Without-FAANGs formed similarly but excluding Facebook, Apple, Amazon, Netflix, Alphabet (Google). Source: Dimensional, using data from CRSP.
[2] The onset of broad coverage of all-cap stock data across developed and emerging markets.
[3] All eligible common stocks in all eligible developed and emerging markets, ranked by total return. Source: Dimensional, using data from Bloomberg LP.