
Wealth management underperformance: the exposed secret that could cost you millions
- Robin Powell

- Apr 7
- 10 min read
Updated: Apr 8

Wealth management underperformance isn't a dirty secret any more. It's a documented, measurable pattern, and a new report puts a precise pound cost on what it's doing to real portfolios. The question is whether you're still paying for it.
Your wealth manager puts on a good show. The quarterly market commentary lands in your inbox like clockwork. At the annual review, the charts slope upward and the language is reassuring. Some firms go further — investment conferences, big-name speakers, glossy brochures, goodie bags. You leave feeling looked after.
I've spent 15 years arguing that most of this is theatre. That the majority of actively managed funds fail to beat a cheap index tracker. That investors would be wealthier if their adviser stopped trying to outsmart the market and bought one instead. For a long time, nobody wanted to hear it. I once gave a presentation at an adviser conference and was asked to leave — the fund companies sponsoring the event objected to what I'd said. That kind of thing happened more than once. There were stretches where I considered walking away and finding something less thankless to write about.
I didn't. Two books, hundreds of articles and hundreds of videos later, the numbers have settled the argument. The SPIVA Europe Scorecard for 2025 found that 95 per cent of UK large- and mid-cap equity funds trailed their benchmark over ten years. Investors have worked this out for themselves: Calastone data shows actively managed equity funds shed £18.9 billion in 2025 while passive strategies pulled in £12.2 billion. By December, passive funds held 52.5 per cent of assets in the IA UK All Companies sector — overtaking active for the first time.
So ordinary investors have moved. But wealth managers, by and large, haven't. A large proportion still steer clients toward actively managed funds, particularly the big advice chains and the so-called consolidators that buy up smaller firms and funnel clients into in-house products. Most manufacture and distribute their own funds under the same roof, and they reward advisers for recommending them.
In every other well-paid profession, performance is measured against agreed targets. A managing director, a senior partner, a consultant — they sit through annual reviews where the numbers are on the table. Wealth management has dodged that kind of scrutiny for years.
Now, Y TREE's Plugged into Wealth Management 2026 report has finally delivered the performance review the industry hoped you'd never see. The findings make for uncomfortable reading.
How Y TREE measured what your wealth manager won't
For three consecutive years, Y TREE has done something most of the wealth management industry would rather it didn't: measured actual portfolio performance against an objective benchmark. The 2026 edition of its Plugged into Wealth Management report analysed over 550 portfolios across 110 providers. The result: 84 per cent of wealth managers underperformed.
Think of the Y TREE benchmark as a nutrition label for your portfolio. It shows the return you would have earned, net of fees, by taking the same level of risk through a cost-efficient, globally diversified portfolio of equities, bonds and commodities, adjusted for currency differences. Not a comparison to the FTSE 100 or some abstract index. It's what you could have bought, cheaply and easily, for the same risk exposure. It measures whether your manager added or destroyed value.
The three-year trend tells a consistent story. In 2023, 92 per cent of wealth managers fell short. In 2024, 88 per cent. In 2025, 84 per cent. Credit where it's due: the direction is improving. But 84 per cent is still damning, particularly given what markets delivered. Over those three years, the Y TREE benchmark returned an average of 15 per cent a year. Wealth managers captured two-thirds of that, trailing by an average of 4.9 per cent annually. In 2025 alone, the average shortfall was 4.3 per cent.
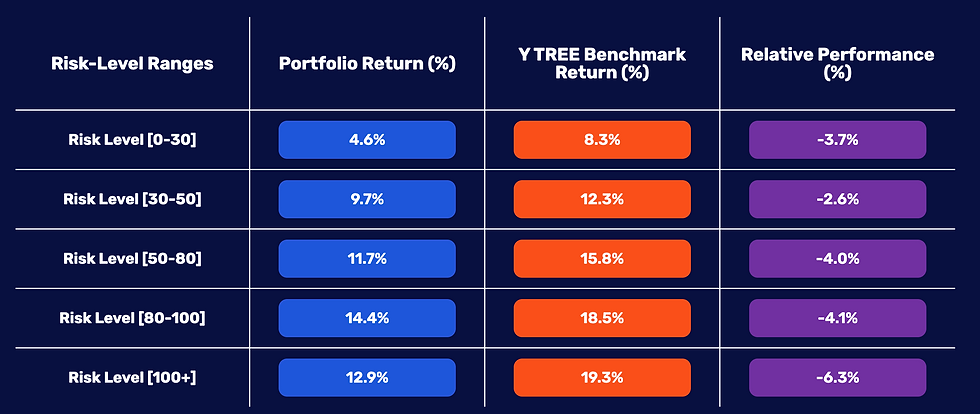
If you're thinking cautious portfolios dragged the average down while higher-risk strategies did better, the numbers say otherwise. Underperformance was consistent across every risk level: cautious portfolios lagged by 3.7 per cent, moderate by 2.6 to 4.0 per cent, high-risk by 4.1 per cent. The most aggressive strategies fared worst of all, trailing by 6.3 per cent. Taking more risk didn't improve your odds. If anything, it gave your manager a longer runway on which to make more expensive mistakes.
Want to know how YOUR wealth manager has really performed?
Where the value was destroyed
The single biggest drag on returns was security selection — the core activity wealth managers are paid to do. On average, the specific investments chosen by managers reduced returns by 3.4 per cent. This figure isolates manager decisions from broader market movements. Bad luck doesn't explain it.
Allocation decisions were mixed. A traditional bias toward UK assets and an underweight to expensive US technology stocks partly helped during a volatile first half. But those gains were more than offset by underexposure to Europe and emerging markets, both of which delivered strong returns.
Fees made the picture worse. They were highest in medium-to-low and very high-risk portfolios, amplifying the shortfall where value added was already thin. Nearly half of the investors Y TREE surveyed didn't know what they were paying. Charges ran as high as 1.9 per cent. And that's before the performance drag is counted.
Then there's the asymmetry. Over the three years since 2023, 88 per cent of managers underperformed, with the worst trailing the benchmark by more than 20 per cent a year. Only 12 per cent beat it, and the best of them delivered upside of 6.6 per cent. Even if you happened to pick one of that minority, their collective gains weren't enough to offset the damage done by the rest. The deck is not evenly stacked.

Want to know how YOUR wealth manager has really performed?
What wealth management underperformance actually costs you
Basis points sound abstract. Years of your life don't.
Y TREE's report models the long-term impact on a £5 million portfolio. At 3 per cent annual drag over 20 years, the gap between what you earned and what you should have earned reaches £7.67 million. More than the original portfolio.

Scale it to different lives and the numbers still bite. A senior professional earning £1 million a year with a £10 million portfolio: at 3 per cent annual drag over a decade, the shortfall exceeds £4.5 million, roughly 8.5 additional years of work to recover what was lost. At £500,000, the same drag over 20 years forfeits roughly £767,000. A house deposit. A child's university fees. Several years of retirement income. Gone — not because the market failed, but because someone was paid to make decisions that subtracted value.
And 3 per cent is the conservative figure. Y TREE measured an actual average of 4.3 per cent in 2025 and 4.9 per cent across the full three years. At 4.3 per cent annual drag, you lose 34 per cent of your portfolio value over a decade and need 18 additional years to recover. At the worst-case average of 5 per cent, the numbers are 38 per cent lost and 30 years.

Want to know how YOUR wealth manager has really performed?
BlackRock's long-term capital market assumptions place global equity returns at 6 to 7 per cent a year. If your wealth manager is trailing by 4 to 5 per cent, they're giving back most of your expected returns. You're taking the risk. Someone else is keeping the reward.
Imagine receiving your own annual performance review and discovering you'd given back a third of your output, every year, for a decade. You wouldn't schedule a follow-up meeting. You'd want answers.
'You're taking the risk. Someone else is keeping the reward.'
Why you probably don't know this is happening to you
If 84 per cent of wealth managers underperformed, why do 96 per cent of wealthy investors believe their portfolio did well?
When Y TREE commissioned an independent poll of 250 high-net-worth individuals in February 2026, the confidence was striking. 59 per cent described themselves as "very confident" they knew how their investments had performed. 58 per cent believed their portfolio matched the market. And 36 per cent believed they had outperformed it, a figure that rose to 57 per cent among those with over £10 million in investable assets.

Want to know how YOUR wealth manager has really performed?
Part of the explanation lies in how investors judge performance. 22 per cent based their assessment on what their adviser told them. Another 20 per cent benchmarked against inflation. Very few compared their returns to what they should have earned, net of fees, for the risk they were taking. These aren't careless people. They haven't been given the right measuring tools.
But there's something deeper at work. A 2021 study by Walters, Fernbach, Fox and Sloman found that investor memory is positively biased in two distinct ways. First, distortion: people recall their returns as better than they were, inflating winners and softening losses. Second, selective forgetting: losing investments are less likely to come to mind at all. Both biases independently predicted overconfidence. Your internal track record is fiction. You're not consulting the numbers. You're consulting the edited highlights.
The industry's reporting practices reinforce the illusion. Investors are shown absolute returns or comparisons to broad market indices rather than a risk-matched benchmark reflecting the true exposure of their portfolio. When your statement shows a positive number and your adviser tells you it was a good year, why would you question it?
One in four investors in Y TREE's survey have never changed their wealth manager. When the illusion of good performance goes untested against objective measurement, loyalty becomes inertia. And inertia has a compounding cost.
This isn't an outlier: the evidence spans decades
Y TREE's findings might look dramatic in isolation. They're not. They sit within a global body of research built over decades.
The mathematics were settled in 1991, when William Sharpe published a paper so simple it barely needed a formula. Before costs, the average actively managed pound must match the average passively managed pound, because together, active and passive investors are the market. After costs, the actively managed pound must be worth less. Not might be. Must be. This isn't a theory that depends on market conditions or manager talent. It's arithmetic.
The SPIVA Europe Persistence Scorecard confirms what the arithmetic predicts. Of UK equity funds that ranked in the top half of performance, just 3 per cent were still there after five consecutive years. For funds in the top quartile, the figure was zero. Not low. Zero. If you're tempted to think the small minority who beat Y TREE's benchmark will keep doing so, the persistence data says you're wrong. Today's outperformers are tomorrow's average — or worse.
And the damage doesn't stop at manager selection. Morningstar's Mind the Gap 2025 research found that investors' own timing decisions, from buying to selling to switching, cost them roughly 1.2 percentage points a year over the decade to December 2024. Around 15 per cent of total returns forgone, on top of whatever their manager lost through poor stock picking. And remember the memory bias: not only is your timing bad, you don't even remember it accurately. You're losing money in two places and noticing neither.
Y TREE's three-year trend does show improvement, from 92 per cent underperforming to 84 per cent. But that proportion, sustained across 550 portfolios during three years of strong equity returns, is not a market correcting itself. Wealth management underperformance on this scale, persisting through a bull market, tells you the problem is structural, not cyclical.
The way to win the loser's game
Nearly 50 years ago, Charles Ellis described active management as a loser's game. Not because the players lack ability, but because the game itself is structured so that most participants must lose. When professionals compete against professionals in a market collectively priced by their own decisions, the winner is the one who makes the fewest costly mistakes, not the most brilliant moves. The way to win is to stop playing.
That doesn't mean you have to sack your wealth manager tomorrow. But it does mean demanding the kind of scrutiny you'd apply to any other professional relationship. Start here.
Ask for your performance against a risk-matched benchmark, net of all fees — not the FTSE 100, not an absolute return figure, not a reassuring chart with no context. If your manager can't or won't provide this, that tells you something.
Find out your total cost. Nearly half the investors in Y TREE's survey didn't know what they were paying. You can't judge value if you don't know the price.
Compare what you're getting to what a simple, globally diversified passive portfolio would have delivered for the same level of risk. The answer may be uncomfortable. It's better to know.
The cost of not knowing isn't just personal. Across the industry, wealth management underperformance represents a vast transfer of wealth from investors to an intermediary layer that, on aggregate, subtracts value. That's money that doesn't reach the real economy: not as consumer spending, not as pension income, not as philanthropy. For pension savers, it means later retirements and smaller legacies. In this game, the only guaranteed winners are the firms collecting the fees. Everyone else pays.
Your move
You've now seen the performance review the industry never wanted you to see. The question is what you do with it.
A decade or so ago, I stood in front of a room full of advisers and told them what the research said. They asked me to leave. The fund companies sponsoring the event didn't want to hear it, and neither did most of the people in the room.
The findings haven't changed since then. They've got harder to ignore. Sharpe's arithmetic is the same today as it was in 1991. Ellis's loser's game hasn't become any more winnable. And now, thanks to Y TREE's analysis of 550 real portfolios, wealth management underperformance isn't an abstract academic finding. It's a measured, compounding cost with a pound sign in front of it.
You no longer have to take anyone's word for it, including mine. The data exists. The benchmarks exist. The low-cost alternatives exist. The only thing that was missing was the performance review — and you've just read it.
What you do next is up to you. But the arithmetic hasn't changed, the research hasn't changed, and the cost of pretending otherwise gets larger with every year that passes.
Want to know how YOUR wealth manager has really performed?
Resources
S&P Dow Jones Indices. (2026). SPIVA Europe Scorecard Year-End 2025. S&P Dow Jones Indices LLC.
Calastone. (2026). Fund Flow Index: January 2026. Calastone.
Y TREE. (2026). Plugged into Wealth Management 2026. Y TREE.
Walters, D.J., Fernbach, P.M., Fox, C.R. & Sloman, S.A. (2021). Investor memory of past performance is positively biased and predicts overconfidence. Proceedings of the National Academy of Sciences, 118(36), e2026680118.
S&P Dow Jones Indices. (2025). SPIVA Europe Persistence Scorecard Year-End 2024. S&P Dow Jones Indices LLC.
Sharpe, W.F. (1991). The arithmetic of active management. Financial Analysts Journal, 47(1), 7–9.
Morningstar. (2025). Mind the Gap 2025. Morningstar Research Services.
Ellis, C.D. (1975). The loser's game. Financial Analysts Journal, 31(4), 19–26.
BlackRock. (2025). Capital Market Assumptions: November 2025. BlackRock Investment Institute.
Recently on TEBI
Good financial advisers do exist, and they add substantial value. We can put you in touch with one.
Everyone listed has publicly signed up to evidence-based principles — no active fund sales, no market-timing, no hidden incentives. Have a look at who's operating near you and start a conversation.
For advisers: Want to attract clients who think like this? Email Robin or connect on LinkedIn to talk about what a content programme could do for your practice.


