The Evidence-Based Investor

Tag Archive: ben johnson

  1. The percentage of outperforming funds fell again in 2021

    Comments Off on The percentage of outperforming funds fell again in 2021


    The year-end 2021 instalment of the Morningstar Active/Passive Barometer has just been published, and it shows that fewer than half of active funds delivered for investors last year. So, what are the key takeaways from these latest findings? BEN JOHNSON is director of global ETF research for Morningstar and editor of Morningstar ETFInvestor. 


    Actively managed funds’ success rate slipped in 2021: 45% of the active funds across the 20 Morningstar Categories included in the year-end 2021 Morningstar Active/Passive Barometer both survived and outperformed their average passive peer. This marks a slight decline from 2020, when 49% of actively managed funds lived and beat their typical indexed peer.

    We further analyse these findings and more in the year-end 2021 instalment of the Morningstar Active/Passive Barometer. The Active/Passive Barometer measures active fund managers’ performance relative to their passive peers. The study spans more nearly 4,000 funds that together accounted for approximately $18.7 trillion in investor assets, or about 67% of the U.S. fund market as of Dec. 31, 2021.

    Here, I’ll discuss how investors might use this report to better understand the odds of picking successful active managers and how they might winnow the field to improve their chances of partnering with those most likely to do well in the future. I’ll also provide a summary of our most recent findings.


    Base rates

    In his book Thinking, Fast and Slow [1], Nobel Prize-winning psychologist Daniel Kahneman discusses how he stumbled upon two different approaches to forecasting while working for Israel’s Ministry of Education to write a high school textbook about judgment and decision-making. Kahneman and his longtime collaborator Amos Tversky ultimately branded these two schools of forecasting as “the inside view” and “the outside view”. The inside view is deeply personal. In constructing a forecast based on the inside view, we focus very narrowly on our own unique experiences and situation and extrapolate from there. (For example, I’m an above-average driver with a squeaky-clean driving history about to go on a short trip in fair weather. The odds of me getting in a fender bender are almost nil.) On the other hand, a forecast based on the outside view starts with a survey of the broader population and is refined based on any specifics regarding the circumstances. (Start with the odds of any driver getting in a fender bender regardless of driving history, the distance traveled, or weather conditions, and go from there.) The outside view is anchored to a base rate. Kahneman explains the concept of base rates in Thinking, Fast and Slow:

    “… It provided a reasonable basis for a baseline prediction: The prediction you make about a case if you know nothing except the category to which it belongs. This should be the anchor for further adjustments. If you are asked to guess the height of a woman and all you know is that she lives in New York City, for example, your baseline prediction is your best guess of the average height of women in the city. If you are now given case-specific information–that the woman’s son is the starting center of his high school basketball team–you will adjust your estimate.”

    Depending on the problem at hand, starting from the outside and working in may be a recipe for better predictions and, thus, better decisions. I would argue that this approach has a multitude of applications within the realm of investing. I’ll share with you some base-rate data that is specific to success rates among active fund managers, and how investors can work from the outside to begin to zero in on winners.


    Morningstar Active/Passive Barometer’s unique approach to measuring performance

    The Morningstar Active/Passive Barometer is a semiannual report that measures the performance of U.S. active managers against their passive peers within their respective categories. The Active/Passive Barometer report is unique in the way it measures active managers’ success relative to the actual, net-of-fee performance of passive funds rather than an index, which isn’t investable.

    The central question the report seeks to answer is: If an investor were to select an actively managed fund at random from a category, what are the odds that fund will survive and outperform its passive peers in any given time period?

    We measure active managers’ success relative to investable passive alternatives in the same category. For example, an active manager in the U.S. large-blend category is measured against a composite of the performance of its index mutual fund and exchange-traded fund peers (Vanguard Total Stock Market Index (VTSMX), SPDR S&P 500 ETF (SPY), and so on). Specifically, we calculate the equal- and asset-weighted performance of the cohort of index-tracking (“passive”) options in each category that we examine, and we use that figure as the hurdle that defines success or failure for the active funds in the same category. The magnitude of outperformance or underperformance does not influence the success rate. However, these data are reflected in the average return figures for the funds in each group and the distribution of 10-year excess returns for surviving active funds, which we report separately.

    We believe this is a better benchmark because it reflects the performance of actual investable options and not an index. Indexes are not directly investable. Their performance does not account for the real costs associated with replicating their performance and packaging and distributing them in an investable format. In addition, the success rate for active managers can vary depending on one’s choice of benchmark. For example, the rate of success among U.S. large-blend managers may vary depending on whether one uses the S&P 500 or the Russell 1000 Index as their basis for comparison. By using a composite of investable alternatives within funds’ relevant categories as our benchmark, we account for the frictions involved in index investing (such as fees), and we mitigate the effects that might stem from cherry-picking a single index as a benchmark. The net result is a fairer comparison of how investors in actively managed funds have fared relative to those who opted for a passive approach.

    We measure each fund’s performance based on the asset-weighted average performance of all its share classes in calculating success rates. This approach reflects the experience of the average dollar invested in each fund. We then rank these composite fund returns from highest to lowest and count the number of funds whose returns exceed the equal-weighted average of the passive funds in the category. The success rates are defined as the ratio of the number of active funds that both survived and outperformed the average of their passive peers to the number of funds that existed at the beginning of the period. Given this unique approach, our field of study is narrower than others’, as the universe of categories that contained a sufficient set of investable index-tracking funds was fairly narrow at the end of 2011, the starting point for our latest study. The number of categories we include in this study has expanded over time and will continue to grow.

    We also cut categories along the lines of cost. Cost matters. Fees are the one of the best predictors of future fund performance. We have sliced our universe into fee quintiles to highlight this relationship.


    A few pictures are worth thousands of words

    As is apparent in Exhibit 1, actively managed funds have generally underperformed their passive counterparts, especially over longer time horizons. In addition, we found that failure tended to be positively correlated with fees (that is, higher-cost funds were more likely to underperform or be shuttered or merged away, and lower-cost funds were likelier to survive and enjoyed greater odds of success). Again, fees matter. They are one of the only reliable predictors of success.

    In general, actively managed funds have failed to survive and beat their average passive peer, especially over longer time horizons. Only 26% of all active funds topped the average of their passive rivals over the 10-year period ended December 2021. Long-term success rates were generally higher among foreign-stock, real estate, and bond funds and lowest among U.S. large-cap funds.
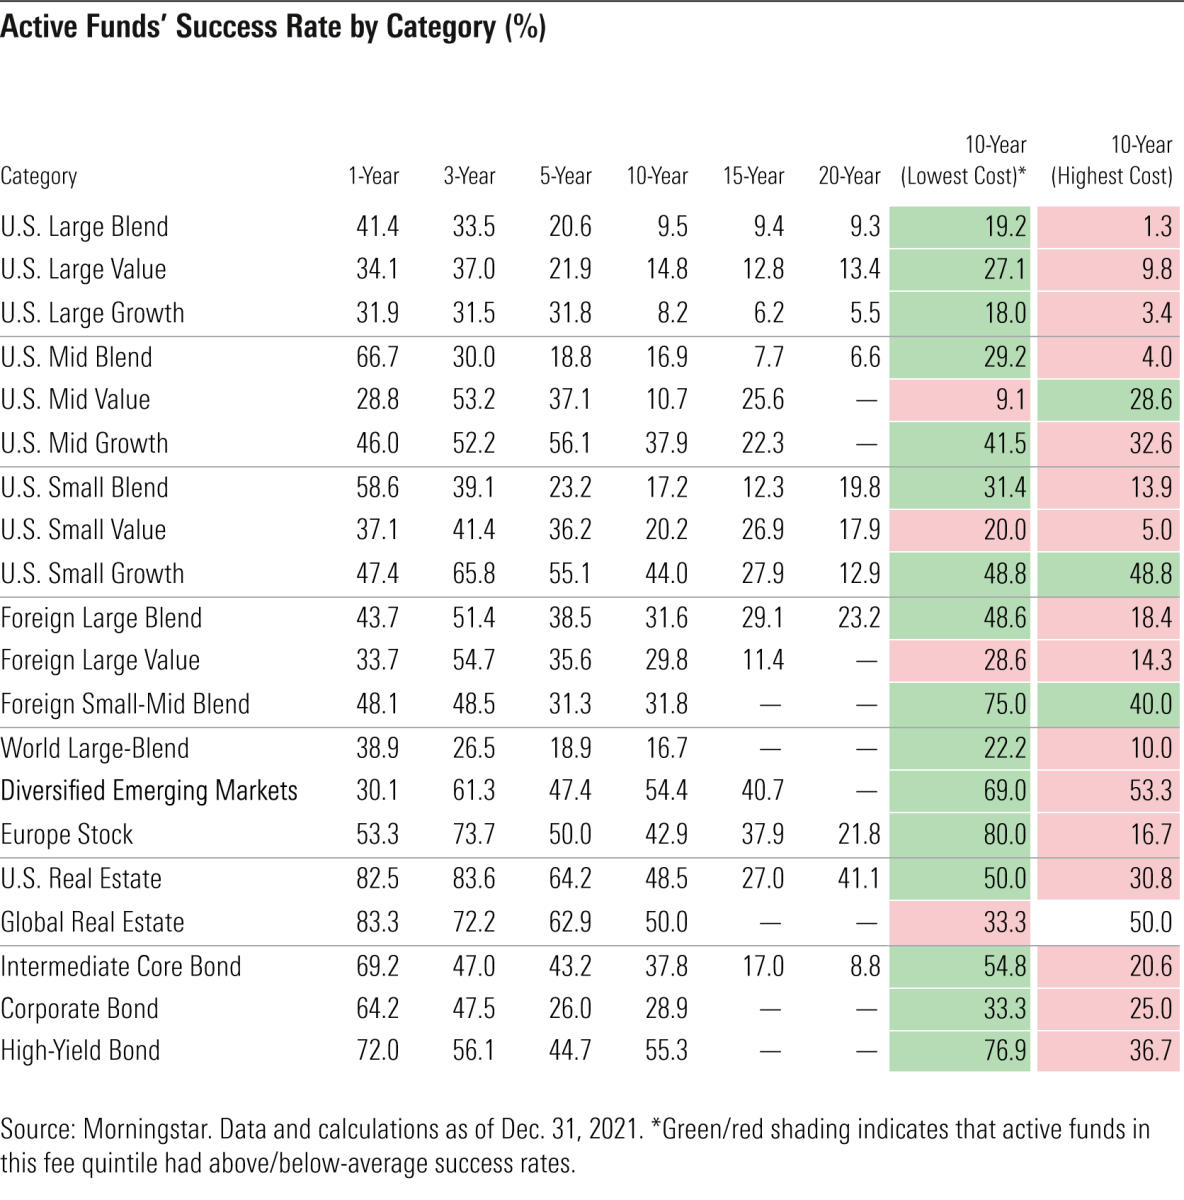


    Active funds' success rate by category


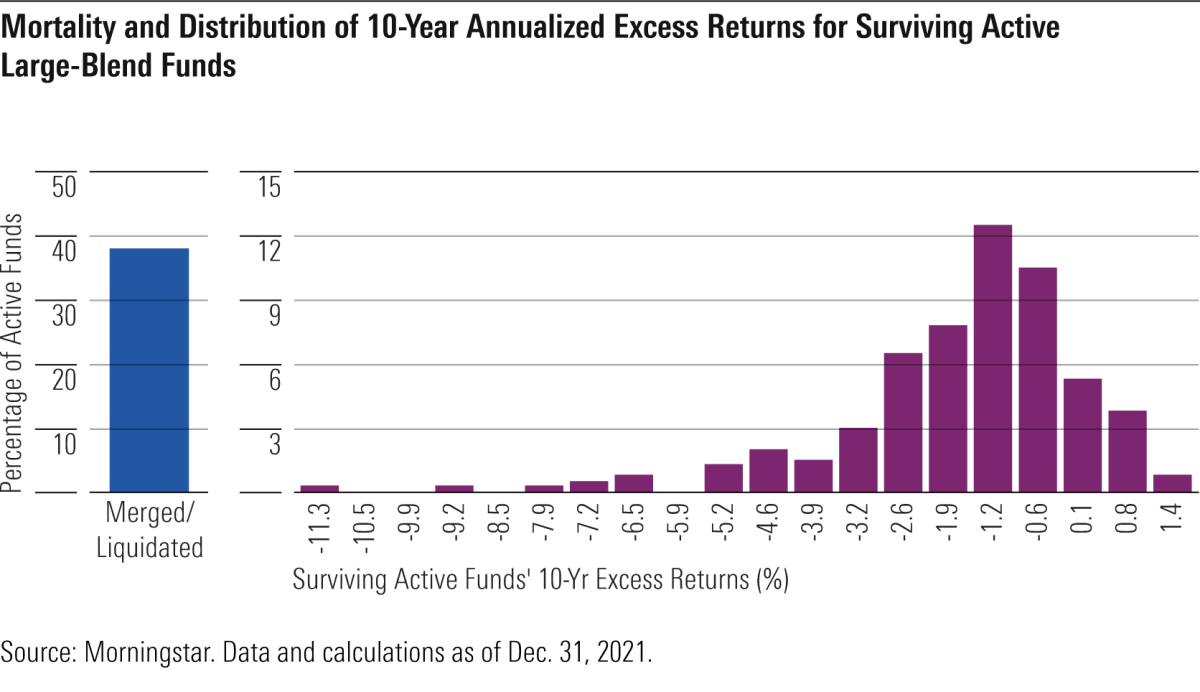
    In combination with success rates and fee sorts, the distribution of active funds’ excess returns can help investors decide where best to allocate their active risk budget. This data can help to size the potential payout or penalty to manager selection. For example, the U.S. large-blend category hasn’t been favorable for stock-pickers. The long-term odds of choosing a successful active manager in this category are low. The potential payout from partnering with a winner isn’t particularly compelling. Exhibit 2 shows the distribution of excess returns among surviving active large-blend funds for the decade through December 2021. The negative skew shows that the cost of picking an unsuccessful manager was generally greater than the gains associated with one that succeeded over this span.


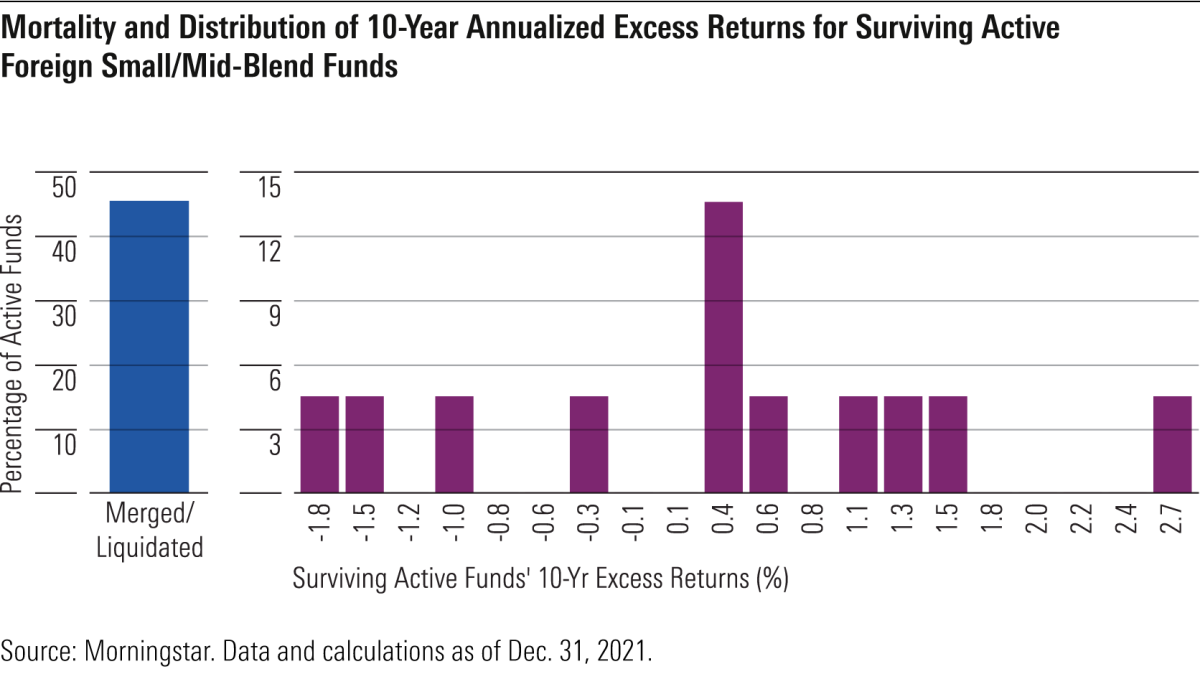
    The counter example to the U.S. large-blend category is the foreign small/mid-blend category. In this case, the distribution of excess returns among surviving active managers skews positive–a much more favorable payout profile.


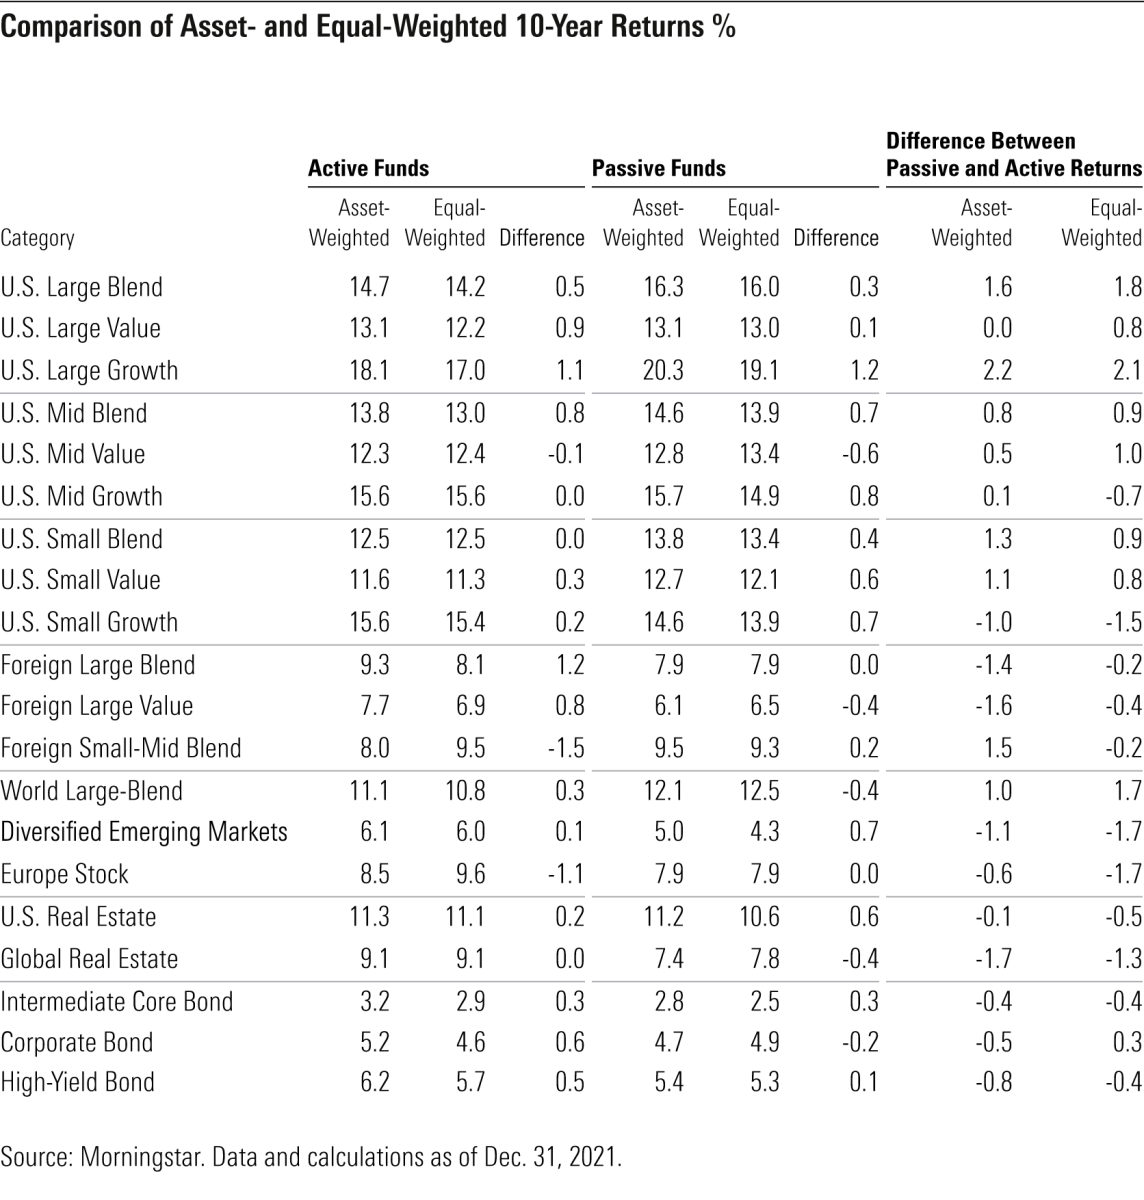
    While a minority of actively managed funds have succeeded over the long term, investors have generally chosen above-average funds. Active funds’ asset-weighted average returns (which measure the performance of the average investor dollar) matched or exceeded equal-weighted returns (which measure the performance of the average fund) in 17 of the 20 categories we examined over the decade through the end of 2021, as shown in Exhibit 4. The difference between active and passive funds’ asset-weighted returns also contains useful information. In those cases where passive funds’ asset-weighted returns exceeded those of active funds, investors generally had more success with the former, and vice versa. So, over the past 10 years, investors generally fared much better with large-growth index funds than active ones. Conversely, they were better served by active managers in the emerging-markets categories than passive options.


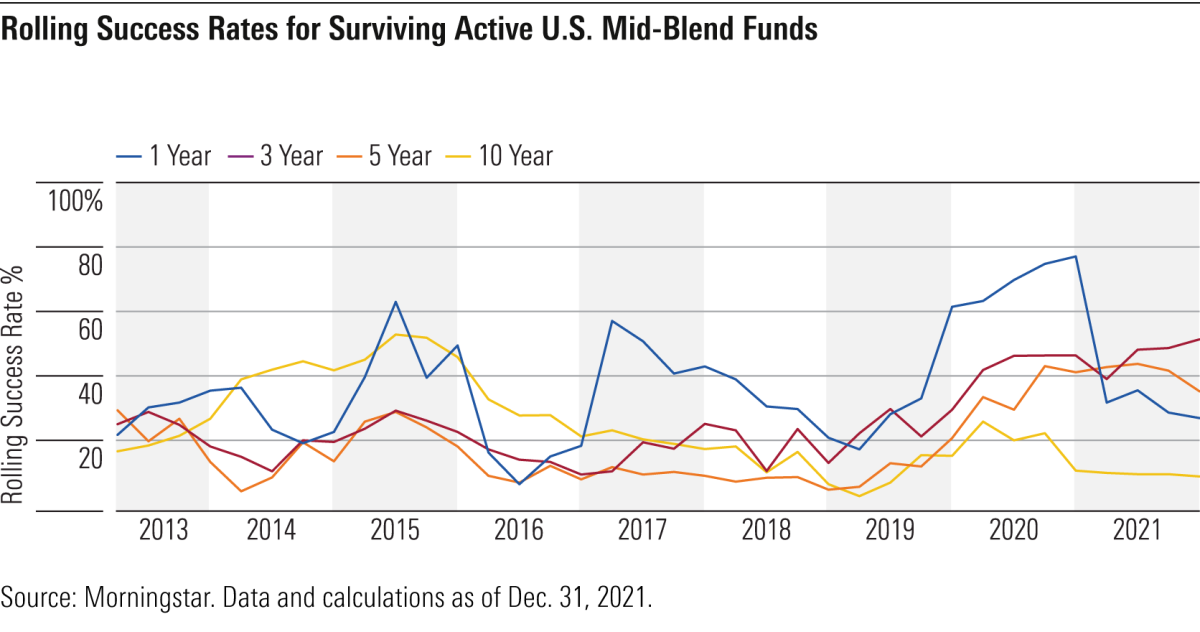
    Actively managed funds’ short-term success rates are noisy. Their volatility can be influenced by countless factors. Over longer time horizons, there is less noise, and the signal regarding active funds’ odds of succeeding is clearer. In this instalment of our semiannual report, we have introduced charts that plot rolling success rates for active funds in each category, which better depict this phenomenon.

    This is very apparent in the case of mid-blend funds. Exhibit 5 plots rolling success rates for actively managed funds in the category that represents a crossroads in the U.S. Morningstar Style Box. Short-term success rates can fluctuate dramatically in this space, as managers are buffeted by shifts in style leadership across the small-to-large and value-to-growth spectrums. But over a longer horizon the signal resonates with those that register across most other categories–long-term successes are rare.


    Back to base rates

    The Active/Passive Barometer is a useful starting point for investors looking to take the outside view when it comes to picking successful active managers. As for working from the outside in, it is little surprise that focusing on fees and picking your spots are some of the best ways to boost your base rate.

     [1] Kahneman, D. 2011. Thinking, Fast and Slow. (New York: Farrar, Straus and Giroux).


    Disclosure: Morningstar, Inc. licenses indexes to financial institutions as the tracking indexes for investable products, such as exchange-traded funds, sponsored by the financial institution. The license fee for such use is paid by the sponsoring financial institution based mainly on the total assets of the investable product. Please click here for a list of investable products that track or have tracked a Morningstar index. Morningstar, Inc. does not market, sell, or make any representations regarding the advisability of investing in any investable product that tracks a Morningstar index.


    MORE FROM MORNINGSTAR

    Active share has been a big disappointment 

    What should investors look for in an index?

    Active managers failed their Covid test

    Thematic funds: good stories, poor investments


    OUR STRATEGIC PARTNERS

    Content such as this would not be possible without the support of our strategic partners, to whom we are very grateful. 

    TEBI’s principal partners in the UK are S&P Dow Jones Indices and Sparrows Capital.We also have a strategic partner in Ireland — PFP Financial Services, a financial planning firm in Dublin.

    We are currently seeking partnerships in North America and Australasia with firms that share our evidence-based and client-focused philosophy. If you’re interested in finding out more, do get in touch.


    © The Evidence-Based Investor MMXXII


  2. Even Fidelity has U-turned on indexing. Why won’t you?

    Comments Off on Even Fidelity has U-turned on indexing. Why won’t you?


    By ROBIN POWELL


    I’ve been writing about the logic for low-cost indexing for ten years now. For the first five years, I could just as well have been banging my head against a brick wall. I came in for a fair amount of abuse on social media, and the low point came in June 2017, when I was asked to leave a financial advice conference because my keynote address had apparently upset the sponsors.

    But gradually, and almost imperecptibly, the tide began to turn about three years ago. The abuse tailed off, more and more people shared my content, and financial journalists started coming to me for help and for comments. Now, literally every day there are signs of positive change.

    Today, for instance, there’s a piece by Robin Wigglesworth in the FT about Fidelity, the Boston-based fund manager that is synonymous with active money management. When Jack Bogle launched the first retail index fund in 1975, Fidelity’s chairman Edward Johnson, was a vocal critic. “I can’t believe that the great mass of investors are going to be satisfied with just receiving average returns,” he said at the time.

    But contrast that with Fidelity now. The company’s current chief executive is Edward Johnson’s grand-daughter, Abigail Johnson. In an interview in November 2019 she said this:


    “Every business house has to change. If you don’t change, you’re by definition either on your way to atrophy or you are atrophying. You have to evolve your business and challenge yourself to say, ‘Where are things going?’”


    Since then, Fidelity has begun to compete with Vanguard on fees for index funds, and its little-known passive investment business Geode Capital Management has more than doubled in size to more than £1 trillion. As a result, Fidelity has now overtaken State Street to become the world’s third-biggest money manager.

    “It’s a meaningful moment for the broader world of asset management,” says Morningstar’s Ben Johnson. “For a long period of time, indexing was antithetical for everything that Fidelity stood for.”

    There’s a lesson here for all those businesses that have profited from active management over the years; not just fund managers, but financial advisers, investment consultants, brokerage firms and stockbrokers. You can’t keep burying your heads in the sand. You might not like the idea of change, but you’ll like extinction even less. If even Fidelity is changing its attitude to index funds, why won’t you?

    As Warren Buffett once said, “What the wise do in the beginning, fools do in the end.” Can you really afford to delay the inevitable any longer?


    ROBIN POWELL is the editor of The Evidence-Based Investor. He is a journalist specialising in finance and investing. He is the founder of Ember Television and Regis Media, and is Head of Client Education for the financial planning firm RockWealth. His book, Invest Your Way to Financial Freedom, co-authored with Ben Carlson, was recently published by Harriman House.


    ALSO BY ROBIN POWELL 

    Hamish Douglass, the fund star who fell to earth

    Luck, skill and Cathie Wood

    The reasons why investors stick with losers

    The chart that shows active management is dead

    Market efficiency is nothing new


    OUR STRATEGIC PARTNERS

    Content such as this would not be possible without the support of our strategic partners, to whom we are very grateful. 

    TEBI’s principal partners in the UK are S&P Dow Jones Indices and Sparrows Capital.We also have a strategic partner in Ireland — PFP Financial Services, a financial planning firm in Dublin.

    We are currently seeking partnerships in North America and Australasia with firms that share our evidence-based and client-focused philosophy. If you’re interested in finding out more, do get in touch.


    Picture: Ozark Drones via Unsplash


    © The Evidence-Based Investor MMXXII


  3. What to look for in an index

    Comments Off on What to look for in an index


    Just because you decide you want to index, that doesn’t mean you have no more decisions to make. There are still some key choices ahead of you. One such decision is which index you’re going to invest in — and there are literally thousands to choose from. So what traits do the best indexes have in common? Morningstar’s BEN JOHNSON sets out the basic elements you need to be looking for.


    Index methodologies are index funds’ DNA. They are the instructions that dictate how indexes—and by extension index funds — select and weight their constituents. They impose constraints. They put in parameters for regular upkeep. Index methodologies define the makeup of an index fund’s portfolio, its return potential, and its risk.

    Understanding index construction is central to index fund due diligence. Here, I’ll discuss its place in Morningstar’s ratings process, share a template for decoding index funds’ DNA, and list some of the traits of the best indexes.


    Suss the process

    The Morningstar Analyst Rating is a forward-looking, qualitative rating. Our analysts do deep due diligence on a wide array of investment strategies (active, passive, and all things in between) and a variety of investment vehicles (mutual funds, exchange-traded funds, separately managed accounts, and more) to assess which ones we believe to be investment-worthy and which we think investors should avoid. In assigning these ratings, we explicitly score the people, parent firm, and process behind each strategy.

    When we rate index funds, process is paramount. Our Process Pillar ratings receive an 80% weight in calculating our overall rating for index funds. Why? Because our assessment of index funds’ processes centres around their index methodologies — their DNA. While we favor experienced, well-resourced index portfolio management teams (our People Pillar rating gets a 10% weight in our overall rating for index funds) and parent firms that align their interests with those of their investors (our Parent Pillar rating gets a 10% weight), nurture tends to take a back seat to nature when it comes to index portfolios.

    If we’re primarily concerned with index construction when assigning Analyst Ratings to index funds, how do we go about putting benchmarks through their paces?


    The circle of index construction

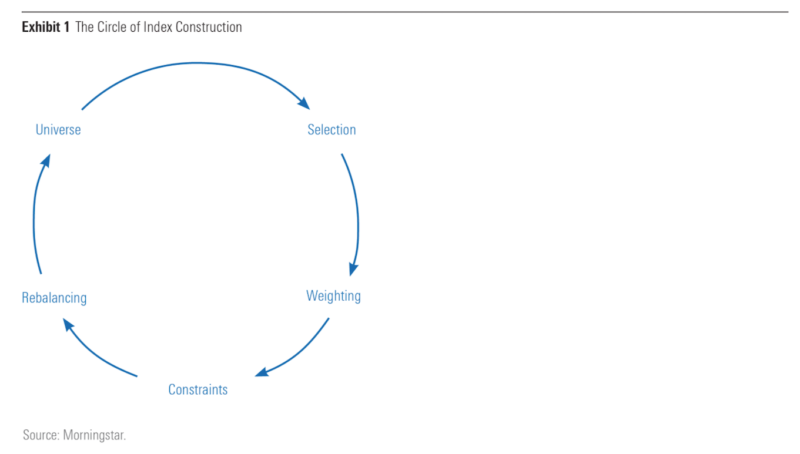
    The diagram below illustrates what I’ll call the circle of index construction. It is important to remember that indexes are living things. They measure the markets but are affected by the markets just as much, and they’re always evolving. The circle is meant to evoke this vitality.

    The circle of index construction — Ben Johnson from Morningstar

    Universe. All indexes draw from a specific universe of eligible constituents. The scope of these selection universes ranges from the entire investable market capitalisation of U.S.-listed stocks to green bonds to commodities futures contracts to cryptocurrencies and beyond. An index’s universe represents its investment opportunity set—its palette. A broader and more-diverse palette allows an index to better represent its opportunity set and gives it more potential directions to set out on. A narrower universe equals a less vibrant palette. Global stocks represent a broad universe, Malaysian micro-caps a tiny one. The breadth, depth, and diversity of indexes’ selection universes have important implications for the makeup of their portfolios.

    Selection. The next stop on our trip around the circle of index construction pertains to how an index selects its constituents from its selection universe. Just how picky is the index? Broad-based, market-cap-weighted indexes are minimally selective. They’ll often weed out tiny, thinly traded securities that would be costly to include in the index’s portfolio. As a result, these benchmarks wind up sweeping in virtually everything available to them in their universe. Other indexes are far choosier. Take the Dow Jones U.S. Dividend 100 Index, for example. The index underpins Schwab U.S. Dividend Equity ETF (SCHD). It draws just 100 stocks from a selection universe of more than 2,600. In whittling the field, it kicks out REITs, boots stocks that haven’t paid dividends for at least 10 years in a row, and more. It is crucial to understand the criteria that indexes use to decide what’s in and what’s out of their portfolios.

    Weighting. Once index constituents are chosen, they need to be assigned a weight in the portfolio. There are many ways these weights may be allocated. Weighting stocks and bonds on the basis of their going market value has long been the standard. But the variety of approaches has multiplied over time. Index constituents may be weighted equally, according to their fundamentals, by their exposure to a particular factor or theme, and many, many other ways. Position weights will have a big influence on indexes’ return potential and risk. Those that make bigger bets on a small handful of positions will likely be riskier than those that spread them more evenly. There’s no guarantee that a high level of concentration will yield good results. The only given with a concentrated index is that it will look much different from its selection universe. And decoupling constituents’ weights from their market value will almost certainly increase turnover.

    Constraints. Indexes will often put constraints in place to limit concentration, tether themselves to the index that represents their selection universe, control for unwanted factor exposures, and more. These constraints can be simple, such as a 5% cap on the weight of any individual constituent. They can also be complex, like an optimiser that controls for a range of variables from sector exposures to factor exposures. Knowing what constraints an index has in place and why they are there can help us understand their impact on the portfolio.

    Rebalancing. Indexes need to be refreshed regularly. Markets change, and indexes adapt to these changes through the process of rebalancing. The need to rebalance could be driven by corporate actions. New initial public offerings might have to be added to stock indexes, assuming they are eligible. Newly issued bonds may need to be included in fixed-income benchmarks. Other changes might be more frequent and of greater magnitude. Equal-weighted indexes regularly rebalance their constituents’ share of the benchmark’s value. Momentum indexes are regularly playing catch-up as they’re always looking to target the market’s recent top performers.

    Rebalancing can play a critical role in the performance of some indexes, most notably factor-focused benchmarks. A timely rebalance can provide a lift to performance. For example, Invesco FTSE RAFI U.S. 1000 ETF (PRF) rebalanced into the teeth of the March 2009 market nadir. Doubling down on fundamentally cheap stocks just when they were desperately cheap gave PRF a shot in the arm. Conversely, bad timing can hurt performance. This was a lesson iShares MSCI USA Momentum Factor ETF (MTUM) learned coming out of its May 2021 rebalance. The fund rebalanced into the market’s recent winners, which happened to feature many value stocks that had come roaring back following favorable news about coronavirus vaccines in late 2020. MTUM added these stocks just as their comeback was running out of steam, and performance faltered as a result. Rebalance timing luck can result in opportunity costs.[1] And lucky or not, rebalancing always results in transaction costs. It is important to know how indexes manage their regular rebalances and the measures they have in place to mitigate these costs.


    Six traits of the best indexes

    Now that we’ve taken a whirl around the circle of index construction, let’s talk about the traits that typify a good index. These features are common to most of our highest-rated ETFs and index mutual funds, which earn some of our top Process Pillar ratings on account of their benchmarks’ sensible construction.

    Representative. The best indexes are representative of the investment opportunity set or the style that they are trying to capture. Vanguard Total Stock Market ETF (VTI) carries a Morningstar Analyst Rating of Gold, chiefly driven by its High Process Pillar rating. It earns our highest rating on account of the degree to which its index, the CRSP U.S. Total Market Index, represents the investment opportunity set available to its peers. The benchmark captures nearly 100% of the investable market cap of the U.S. stock market. Few indexes are more representative than that. Casting a wide net and weighting by market cap puts the fund in a position to let its low fee shine through and give it a lasting edge versus category competitors.

    Diversified. Diversification is the only free lunch in investing. In the case of index funds with zero fees, and those like VTI and others that effectively earn back their fees through a combination of securities lending and portfolio management savvy, investors will find the closest thing there is to a free lunch in the realm of investing. Diversifying broadly also reduces the likelihood of errors of omission. Over the long haul, a small minority of stocks account for the bulk of the market’s returns. More-inclusive indexes have greater odds of owning the market’s big winners.

    Investable. Investability isn’t an issue for most broad stock and bond benchmarks, but it becomes one in smaller, less-liquid segments of the market like micro-cap stocks and bank loans. Index portfolio managers may have a tough time tracking benchmarks in these corners of the market. Trading can be costly, which makes index-tracking tough. The best indexes cover parts of the market that are easy to invest in, and they take additional measures to ensure investability.

    Transparent. I can’t think of many examples of things inside or outside the realm of investing where complexity and opacity have proved superior to simplicity and transparency. The best indexes are simple and transparent. If you crack open an index methodology document and it reads like the pilot’s manual to a Klingon warship, that’s a red flag.

    Sensible. Does the index methodology make sense? Weighting stocks by their share price might have made sense in 1896, when the Dow Jones Industrial Average was created. This approach made it easier for its publishers to calculate the index’s value. But in 2021, does weighting stocks by their share price still make sense? Today we carry around more computing power in our pockets than existed on the planet at the turn of the 20th century. We have the ability to calculate benchmarks with sensible approaches to selecting and weighting securities in real time.

    Turnover-Conscious. Turnover has explicit (commissions, bid-ask spreads) and implicit (market impact) costs. The best indexes are conscious of these costs and take steps to keep them under wraps. For example, in 2018 CRSP’s U.S. equity indexes transitioned from rebalancing on one day to spreading rebalancing over a five-day period. This was done in an effort to minimise market impact. Other indexes take measures to either slow the rate of turnover or similarly spread it out over a longer period of time—to the benefit of index fund investors.


    Good genes

    When it comes to doing your homework on index funds, understanding index construction is indispensable. Knowing the progressions around the circle of index construction and seeking out the traits of a quality index at each stop will put you in a position to pick best-of-breed funds for your portfolio.


    [1] Hoffstein, C., Faber, N., & Braun, S. 2020. “Rebalance Timing Luck: The (Dumb) Luck of Smart Beta” https://papers.ssrn.com/sol3/papers.cfm?abstract_id=3673910

    Disclosure: Morningstar, Inc. licenses indexes to financial institutions as the tracking indexes for investable products, such as exchange-traded funds, sponsored by the financial institution. The license fee for such use is paid by the sponsoring financial institution based mainly on the total assets of the investable product. Please click here for a list of investable products that track or have tracked a Morningstar index. Morningstar, Inc. does not market, sell, or make any representations regarding the advisability of investing in any investable product that tracks a Morningstar index.


    BEN JOHNSON is director of global ETF research for Morningstar and editor of Morningstar ETFInvestor, a monthly newsletter. This article was first published on the Morningstar blog. 


    MORE FROM MORNINGSTAR

    Active managers failed their Covid test, Morningstar shows

    Thematic funds: good stories, poor investments

    Is value making a comeback?

    Europe’s active managers failed the test in 2020

    US active managers flopped in 2020 — Morningstar

    Which is best for corporate bonds — active or passive?


    PREVIOUSLY ON TEBI

    How good are institutions at selecting private equity managers?

    ESG index investing explained

    A precious investment lesson from JRR Tolkien 

    Corporate culture as intangible asset

    How does carbon risk impact on fund returns?

    Helping a “lost” generation to invest


    NEW INVESTOR?

    If you’re new to investing, TEBI founder Robin Powell and fellow financial blogger Ben Carlson have written a book that you really ought to read. It’s called Invest Your Way to Financial Freedom, and it’s published by Harriman House.

    Primarily written for a UK audience, the book has no hidden sales agenda and is based on peer-reviewed academic evidence. It explains, in simple terms, how young investors can develop good habits, save a fortune in unnecessary fees, and achieve financial freedom many years earlier than they otherwise would.

    You can either buy the book direct from the publisher or via Amazon:

    For those in the UK, 

    Buy the paperback via Harriman House here

    Buy the paperback via Amazon here

    Buy an audio version on Audible here

    For those outside the UK,

    Buy the Kindle version via Amazon here


    © The Evidence-Based Investor MMXXI


  4. Active managers failed their Covid test, Morningstar shows

    Comments Off on Active managers failed their Covid test, Morningstar shows


    It’s often claimed that active management comes into its own during periods of volatility. But the latest instalment of the Morningstar Active/ Barometer shows that active managers in the US have failed to capitalise on the volatility caused by the coronavirus crisis. As Morningstar’s BEN JOHNSON explains, active fund performance has been disappointing across the board in the 12-month period to the end of June this year.


    Of the nearly 3,000 active funds included in our analysis for the Morningstar Active/Passive Barometer, 47% survived and outperformed their average passive counterpart in the 12 months through June 2021. This number isn’t far off from what it was when we assessed these funds at the end of 2020, further reinforcing the view we shared then: There’s little merit to the notion that active funds are more capable of navigating market volatility than their passive counterparts.

    The Active/Passive Barometer is a semi-annual report that measures the performance of U.S. active funds against passive peers in their respective Morningstar Categories. It spans nearly 4,400 unique active and passive funds that accounted for approximately $17.4 trillion in assets, or about 65% of the U.S. fund market, as of the end of June 2021. The full report can be found here.

    You can learn more about the background on our approach in this article. Here, I share more about why this methodology works and take a look at how active funds have been faring.


    How the Active/Passive Barometer assesses active funds

    The Morningstar Active/Passive Barometer is a semiannual report that measures the performance of U.S. active managers against their passive peers within their respective categories. The Active/Passive Barometer report is unique in the way it measures active managers’ success relative to the actual, net-of-fees performance of passive funds rather than an index, which isn’t investable.

    The central question the report seeks to answer is: If an investor were to select an actively managed fund at random from a category, what are the odds that fund will survive and outperform its passive peers in any given time period?

    We measure active managers’ success relative to investable passive alternatives in the same category. For example, an active manager in the U.S. large-blend category is measured against a composite of the performance of its index mutual fund and exchange-traded fund peers (Vanguard Total Stock Market Index (VTSMX), SPDR S&P 500 ETF (SPY), and so on). Specifically, we calculate the equal- and asset-weighted performance of the cohort of index-tracking (“passive”) options in each category that we examine, and we use that figure as the hurdle that defines success or failure for the active funds in the same category. The magnitude of outperformance or underperformance does not influence the success rate. However, these data are reflected in the average return figures for the funds in each group, and the distribution of 10-year excess returns for surviving active funds, which we report separately.

    We believe this is a better benchmark because it reflects the performance of actual investable options and not an index. Indexes are not directly investable. Their performance does not account for the real costs associated with replicating their performance and packaging and distributing them in an investable format. In addition, the success rates for active managers can vary depending on one’s choice of benchmark. For example, the rate of success among U.S. large-blend managers may vary depending on whether one uses the S&P 500 or the Russell 1000 Index as their basis for comparison. By using a composite of investable alternatives within funds’ relevant categories as our benchmark, we account for the frictions involved in index investing (such as fees), and we mitigate the effects that might stem from cherry-picking a single index as a benchmark. The net result is a fairer comparison of how investors in actively managed funds have fared relative to those who opted for a passive approach.

    We measure each fund’s performance based on the asset-weighted average performance of all its share classes in calculating success rates. This approach reflects the experience of the average dollar invested in each fund. We then rank these composite fund returns from highest to lowest and count the number of funds whose returns exceed the equal-weighted average of the passive funds in the category. The success rates are defined as the ratio of the number of active funds that both survived and outperformed the average of their passive peers to the number of funds that existed at the beginning of the period. Given this unique approach, our field of study is narrower than others’, as the universe of categories that contained a sufficient set of investable index-tracking funds was fairly narrow 10 years ago. The number of categories we include in this study has expanded over time and will continue to grow.

    We also cut categories along the lines of cost. Cost matters. Fees are the one of the best predictors of future fund performance. We have sliced our universe into fee quintiles to highlight this relationship.

    Finally, we examine the distribution of 10-year excess returns among surviving funds across each of the 20 categories included in our analysis. The shape of this distribution varies widely across categories. In the case of U.S. large-cap funds, it skews negative, indicating that the penalty for picking an underperforming manager tends to be greater than the reward for finding a winner. The inverse tends to be true of the fixed-income and foreign-stock categories we examined, where excess returns among surviving active managers skewed positive over the past decade.


    Most active managers haven’t capitalised on recent volatility

    The coronavirus sell-off and subsequent rebound tested the narrative that active funds are generally better able to navigate market volatility than their index peers. At year-end 2020, just 49% of the nearly 3,500 active funds included in our analysis survived and outperformed their average passive counterpart — not much of a change from our midyear report, in which 51% of active funds both survived and outperformed their average index peer during the first half of the year. During the 12 months through June 2021, active funds’ one-year success rates dipped slightly versus their full-year 2020 level. Roughly 47% of the nearly 3,000 active funds that were available to investors across the 20 categories included in our analysis in June 2021 both survived and outperformed their average passive peer in their respective Morningstar Category.

    Actively managed U.S. growth funds struggled during the year through June 2021. Success rates among large-, mid-, and small-cap growth managers declined precipitously versus the 12 months through June 2020. The combined success rate among managers of active growth funds was just 27.5%. The spread between growth and value stocks’ performance has recently narrowed dramatically. During the 12 months ended June 30, 2020, the Morningstar US Growth Index outperformed the Morningstar US Value Index by about 35 percentage points. During the year through June 30, 2021, the growth index outperformed its value counterpart by about 4 percentage points. This partly explains the recent volatility we have seen in active growth funds’ short-term success rates.

    The one-year success rate for active funds in the intermediate core bond category jumped nearly 54 percentage points versus the year through June 2020, registering at nearly 85%. The post-COVID-crisis rebound in credit markets has been favorable for active funds in the category, which tend to take more credit risk than their indexed peers.

    In general, actively managed funds have failed to survive and beat their benchmarks, especially over longer time horizons; only 25% of all active funds topped the average of their passive rivals over the 10-year period ended June 2021; long-term success rates were generally higher among foreign-stock, real estate, and bond funds and lowest among U.S. large-cap funds.


    Disclosure: Morningstar, Inc. licenses indexes to financial institutions as the tracking indexes for investable products, such as exchange-traded funds, sponsored by the financial institution. The license fee for such use is paid by the sponsoring financial institution based mainly on the total assets of the investable product. Please click here for a list of investable products that track or have tracked a Morningstar index. Morningstar, Inc. does not market, sell, or make any representations regarding the advisability of investing in any investable product that tracks a Morningstar index.


    BEN JOHNSON is director of global ETF research for Morningstar and editor of Morningstar ETFInvestor, a monthly newsletter. This article was first published on the Morningstar blog. 


    MORE FROM MORNINGSTAR

    Thematic funds: good stories, poor investments

    Is value making a comeback?

    Europe’s active managers failed the test in 2020

    US active managers flopped in 2020 — Morningstar

    Which is best for corporate bonds — active or passive?

    Three things to remember about emerging markets


    PREVIOUSLY ON TEBI

    Front-running — a hidden risk in hedge funds

    It’s a great time to be an investor

    Global warming puts heat on banks

    Quality, the flip side of value

    Clarity in investing is not the same as certainty

    Invest Your Way to Financial Freedom


    NEED AN ADVISER?

    If you need a financial adviser, we may be able to help. 

    Wherever you are in the world, we will try to put you in contact with an adviser in your area whom we know personally, who shares our evidence-based investment philosophy and who we feel is best able to help you. If we don’t know of anyone suitable we will tell you.

    We’re charging advisers a small fee for each successful referral, which will help to fund future content.

    Click here and let’s get started.


    © The Evidence-Based Investor MMXXI